akhtiyar
CIAA Seeks Rs 25.31 Billion in Corruption Cases as Local Governments Draw Nearly Half of Complaints
With almost half of complaints linked to local governments and nearly three-fifths now arriving through websites and email, the data also show that Nepal’s anti-corruption landscape is changing. The CIAA is receiving allegations more quickly and from an increasingly decentralised system of government. Its challenge in the coming years will be to convert that flow of information into investigations that are not only faster, but strong enough to result in durable judicial outcomes.
Dipesh Ghimire
6 min read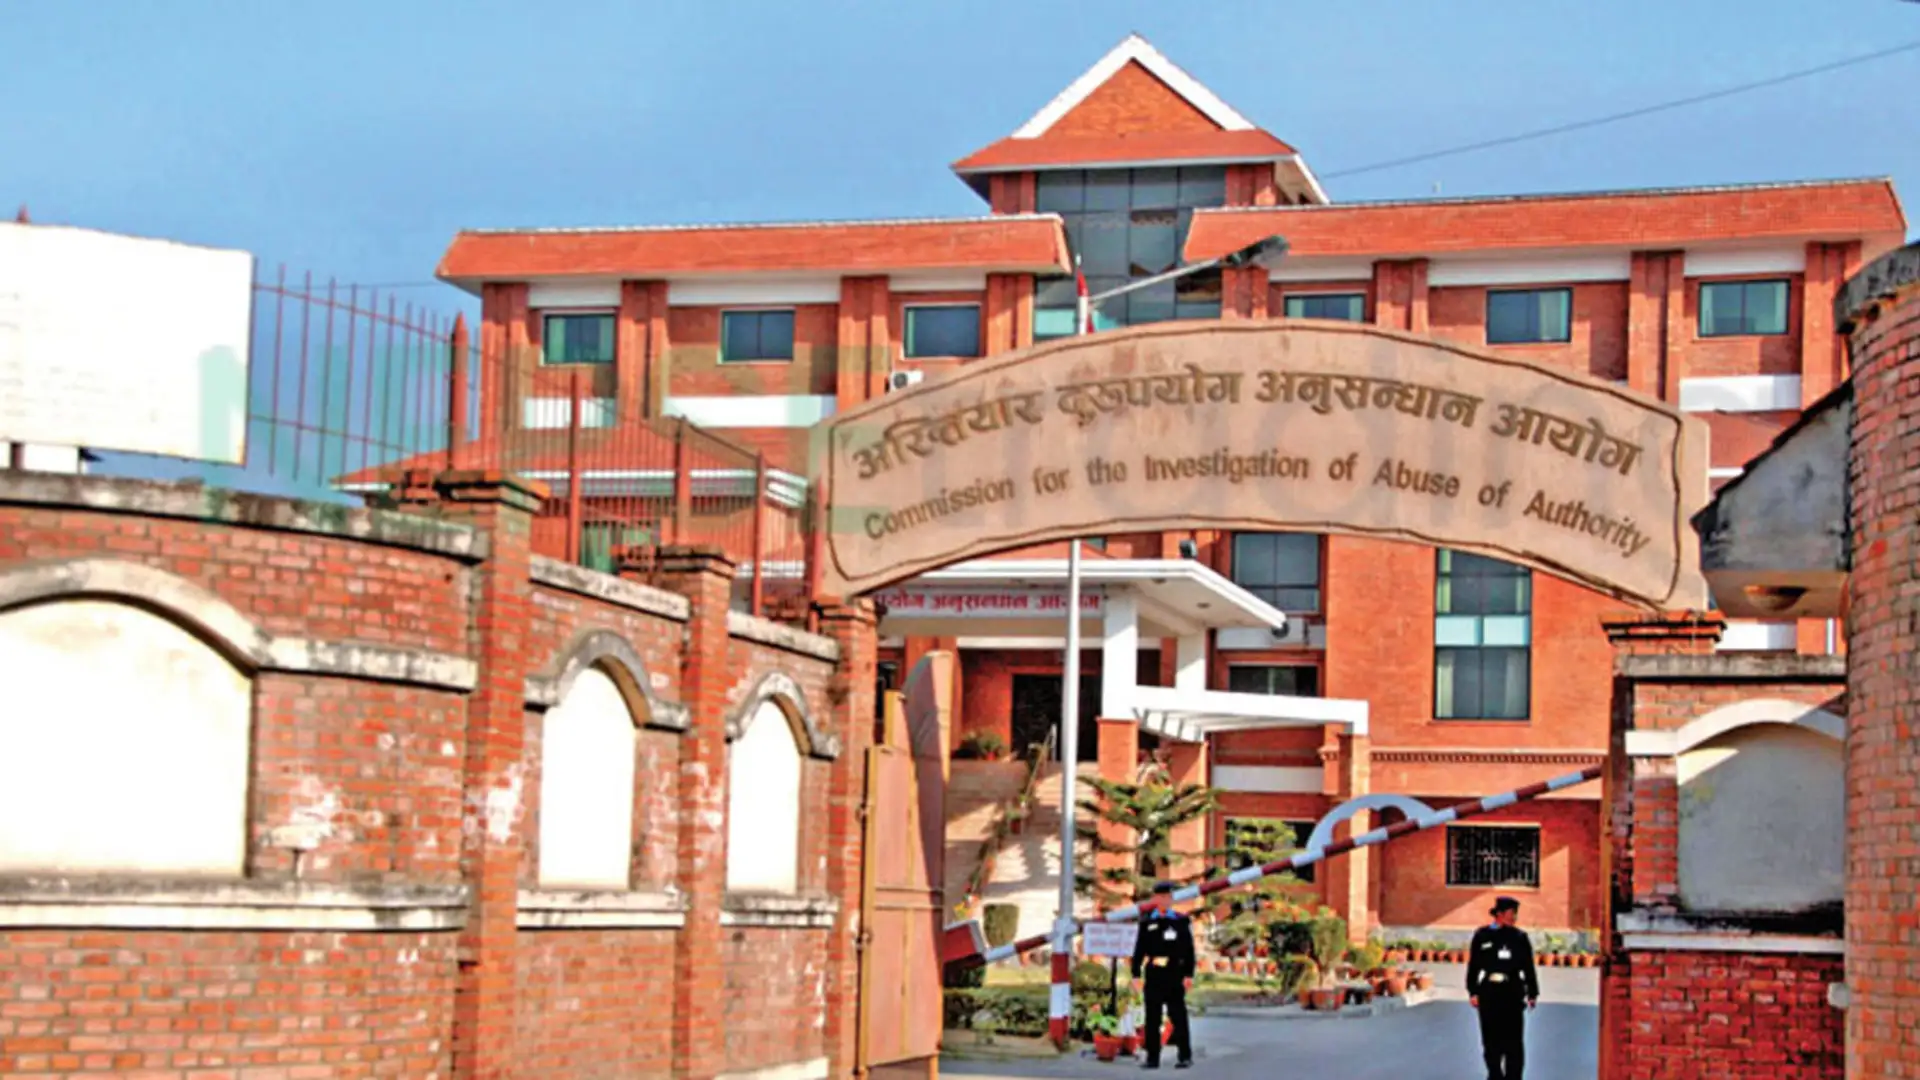
KATHMANDU — Nepal’s anti-corruption watchdog handled more than 40,000 complaints and filed 175 cases involving nearly 1,000 defendants in fiscal year 2082/83, with the amount claimed as losses or illegal gains rising sharply to Rs 25.31 billion. The annual figures, however, also show that strengthening the quality of investigation and prosecution remains a major challenge for the Commission for the Investigation of Abuse of Authority (CIAA).
According to the commission’s annual review, it received 33,328 new complaints during the fiscal year. Another 7,323 complaints were carried over from the previous year, taking the total workload to 40,651 complaints.
Of these, the CIAA disposed of 32,799 complaints, or 80.68 percent, during the year. The remaining 7,852 were carried forward to fiscal year 2083/84. The figures indicate that the commission managed to clear more than four out of every five complaints under consideration, substantially limiting the volume of cases transferred to the new fiscal year.
But the geographical and administrative distribution of complaints presents a more significant picture. Local governments accounted for 48.96 percent of all complaints, the largest share among Nepal’s three levels of government. Based on the total caseload, this represents roughly 19,900 complaints connected with local-level bodies.
Federal government institutions accounted for 38 percent, or roughly 15,450 complaints, while provincial bodies represented just over 13 percent, equivalent to around 5,300 complaints.
The concentration of nearly half of the complaints at the local level is particularly notable because municipalities and rural municipalities have assumed greater responsibility for public spending, infrastructure development, procurement and service delivery under the federal system. The data do not establish that corruption is necessarily more widespread at the local level, since complaint numbers can also be influenced by citizens’ access to institutions and the nature of public spending. They nevertheless show where allegations of misuse of authority are most heavily concentrated.
The way citizens report suspected corruption is also changing. The CIAA website emerged as the single largest complaint channel, accounting for 30.91 percent of submissions. Email accounted for another 27.02 percent.
Combined, the two digital channels generated almost 58 percent of all complaints, suggesting that online reporting has become the principal gateway for citizens approaching the anti-graft agency. Written applications accounted for 21.74 percent and postal complaints 12.87 percent, while the remaining complaints came through telephone, social media, mobile applications, newspapers, the National Vigilance Centre, Hello Sarkar and other channels.
Rs 25.31 billion claimed from 990 defendants
The commission moved from complaints and investigation to prosecution in 175 cases during the year. It filed charge sheets at the Special Court against 990 defendants, meaning that an average case involved more than five accused persons.
The CIAA sought a combined Rs 25.31 billion in damages and recovery claims in those cases. The commission says the amount is nearly four times the figure claimed in the preceding fiscal year.
The steep increase in the monetary value of claims is one of the most striking features of the annual data. It suggests that the commission pursued cases involving substantially greater financial exposure during the year, although a larger claim does not itself establish greater corruption. The amount represents what prosecutors have sought to recover or establish before the court, and final liability depends on judicial decisions.
Public property-related cases formed the largest category of prosecutions. The CIAA filed 56 cases involving alleged loss or damage to public property, accounting for nearly one-third of the 175 charge sheets.
Bribery was the second-largest category with 41 cases, followed by 27 cases involving illegal gain or loss. There were also 15 cases concerning fake or forged academic certificates and 11 involving alleged accumulation of illegal assets.
Five cases related to revenue leakage or embezzlement were filed. The commission also brought four money-laundering cases linked to bribery and one money-laundering case associated with allegedly illegally accumulated assets. Another 15 cases fell under various other categories.
The composition of the cases shows that the commission’s enforcement work extends well beyond conventional cash-bribery cases. Alleged losses to government property and illegal financial benefits together made up a substantial part of prosecutions, pointing to procurement, public assets and administrative decisions as major areas of anti-corruption investigation.
The CIAA also conducted 27 sting operations during the year. Such operations remain one of the commission’s tools for detecting alleged bribery at the point of transaction, although they accounted for only one part of its broader enforcement work.
Court outcomes expose prosecution challenge
Court results present a more mixed picture. The Special Court delivered judgments in 156 CIAA-filed cases during the fiscal year. According to the commission, offences were established in 81 of them, producing a success rate of 51.92 percent.
In practical terms, the figure means that the commission secured a finding of guilt or establishment of an offence in slightly more than one out of every two cases decided during the year.
This is important when viewed alongside the CIAA’s high complaint-disposal rate and the sharp rise in the amount claimed in corruption cases. Clearing complaints and filing high-value cases demonstrate administrative and investigative activity, but the ultimate strength of anti-corruption enforcement is also tested by whether evidence survives scrutiny in court.
Chief Commissioner Prem Kumar Rai appeared to acknowledge that distinction during the annual review. While pointing to progress in complaint disposal, he stressed the need to improve investigative quality and instructed investigation officers to make inquiries faster, more effective and more strongly based on evidence.
The commission’s appeal figures provide another indication of continued disagreement over court outcomes. After receiving full judgments from the Special Court, the CIAA filed 104 appeals at the Supreme Court and sought review in three other cases.
The appeal total is substantial compared with the number of Special Court judgments delivered during the year, illustrating the extent to which litigation continues beyond the first stage of adjudication. It also means that the final legal outcome of a significant number of corruption cases remains unsettled.
Complaint numbers and court cases tell different stories
A comparison between the more than 40,000 complaints handled and 175 charge sheets filed may appear to show a very wide gap. It would, however, be misleading to treat the two numbers as a simple prosecution rate.
Not every complaint constitutes a prosecutable corruption offence. Some may lack evidence, fall outside the CIAA’s jurisdiction, duplicate existing complaints or require administrative rather than criminal action. A single investigation or charge sheet can also arise from multiple complaints. The figures therefore reflect different stages of the anti-corruption system rather than a direct one-to-one conversion from complaint to prosecution.
What is clearer is that the CIAA operates a large screening system: tens of thousands of allegations enter the commission, a large majority are disposed of at different stages, and a much smaller group eventually develops into cases considered strong enough to take before the Special Court.
Focus shifts from volume to quality
Along with enforcement, the commission said it continued preventive and good-governance initiatives. It conducted four district-level interaction programmes and 134 programmes at the municipal level during the year.
The heavy emphasis on municipal-level programmes broadly corresponds with the complaint data, which show local governments generating the largest share of allegations. Preventive intervention at the local level could therefore become increasingly important as local bodies manage larger budgets and undertake more procurement and infrastructure projects.
On its own finances, the commission reported spending 70.13 percent of its recurrent budget and 76.37 percent of its capital budget during the fiscal year.
The annual review ultimately presents two sides of Nepal’s anti-corruption effort. On one side, the CIAA cleared more than 80 percent of the complaints on its books, prosecuted 175 cases involving 990 defendants and sought a record-scale Rs 25.31 billion in damages. On the other, offences were established in only about 52 percent of the cases decided by the Special Court.
That contrast places the quality of investigation at the centre of the commission’s next challenge. Higher complaint disposal, larger financial claims and more prosecutions can demonstrate greater enforcement activity, but their impact will depend on the strength of evidence, the quality of charge sheets and the ability to sustain cases through the courts.
With almost half of complaints linked to local governments and nearly three-fifths now arriving through websites and email, the data also show that Nepal’s anti-corruption landscape is changing. The CIAA is receiving allegations more quickly and from an increasingly decentralised system of government. Its challenge in the coming years will be to convert that flow of information into investigations that are not only faster, but strong enough to result in durable judicial outcomes.
Advertisement
Written by
Dipesh Ghimire