स्टक मार्केटमा साइडवेज भनेको के हो ? मार्केट साइडवेज किन हुन्छ ? यसको प्रभाव ?What Is Sideways in the Stock Market? Why It Happens in market ? and Its Implications ?
साइडवेज भनेको के हो, किन र कहिले हुन्छ?
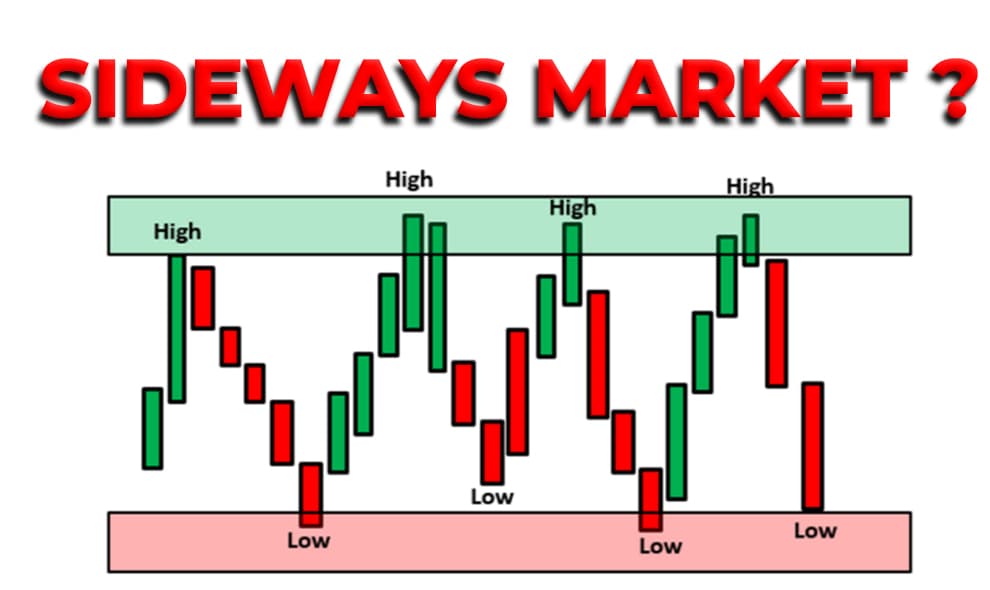
स्टक मार्केटमा "साइडवेज" (Sideways) भनेको बजारको मूल्य एक निश्चित दायराभित्र स्थिर रहने अवस्था हो। यसलाई अंग्रेजीमा "Sideways Trend" वा "Horizontal Trend" पनि भनिन्छ। यो त्यस्तो अवस्था हो जसमा स्टकको मूल्य न त उल्लेखनीय रूपमा माथि जान्छ, न त तल झर्छ। बरु, यो एउटा निश्चित सीमाभित्र (Support र Resistance को बीचमा) घुमिरहन्छ। नेपालीमा यसलाई "बजारको स्थिरता" वा "साइडमा हिँड्ने प्रवृत्ति" भन्न सकिन्छ।
साइडवेज बजार सामान्यतया तब हुन्छ जब बजारमा कुनै ठूलो समाचार, आर्थिक घटना वा नीतिगत परिवर्तनको अभाव हुन्छ। यो अवस्था बजारको "तटस्थ चरण" को रूपमा पनि चिनिन्छ। साइडवेज कहिले हुन्छ भन्ने कुरा बजारको अवस्था र लगानीकर्ताको मनोविज्ञानमा निर्भर गर्छ। उदाहरणका लागि, ठूला कम्पनीहरूको त्रैमासिक नतिजा आउनुअघि, नीतिगत निर्णयको प्रतीक्षा गर्दा, वा विश्वव्यापी आर्थिक अनिश्चितताको समयमा यस्तो अवस्था देखिन्छ।
साइडवेज किन हुन्छ?
साइडवेज बजारका विभिन्न कारणहरू हुन सक्छन्:
लगानीकर्ताको अनिश्चितता: जब लगानीकर्ताहरू बजारको भविष्यबारे निश्चित हुँदैनन्, उनीहरू ठूलो किनबेच गर्न हिचकिचाउँछन्। यसले मूल्य स्थिर राख्छ।
आर्थिक स्थिरता: यदि अर्थतन्त्रमा ठूलो उतारचढाव छैन र ब्याजदर, मुद्रास्फीति, वा रोजगारी स्थिर छ भने बजार साइडवेजमा जान सक्छ।
प्राविधिक विश्लेषणको प्रभाव: धेरै लगानीकर्ताले Support र Resistance लाइन प्रयोग गर्छन्। जब मूल्य यी रेखाहरूमा पुग्छ, किनबेचको सन्तुलनले साइडवेज बनाउँछ।
समाचारको अभाव: ठूला समाचार वा घटनाहरू नहुँदा बजारमा दिशा निर्धारण गर्ने शक्ति कम हुन्छ।
यो बजारका लागि राम्रो कि नराम्रो?
साइडवेज बजार राम्रो वा नराम्रो दुवै हुन सक्छ, यो लगानीकर्ताको रणनीति र दृष्टिकोणमा निर्भर गर्छ।
राम्रो पक्ष:
स्थिरता: साइडवेजले बजारमा अस्थिरता कम गर्छ, जसले नयाँ लगानीकर्तालाई सिक्ने मौका दिन्छ।
फाइदा लिने अवसर: अनुभवी लगानीकर्ताले सानो दायराको मूल्य उतारचढावबाट फाइदा लिन सक्छन्।
जोखिम कम: ठूलो घाटाको डर कम हुन्छ।
नराम्रो पक्ष:
नाफाको सीमा: ठूलो मूल्य वृद्धिको सम्भावना कम हुन्छ।
उदासीनता: लामो समयसम्म साइडवेज रहँदा लगानीकर्ताको रुचि घट्न सक्छ।
अनिश्चितता: यो कहिलेसम्म रहन्छ भन्ने थाहा नहुँदा रणनीति बनाउन गाह्रो हुन्छ।
साइडवेजको प्रभाव
साइडवेज बजारले विभिन्न क्षेत्रमा प्रभाव पार्छ:
लगानीकर्ताको मनोविज्ञान: लगानीकर्ताहरू धैर्यवान हुनुपर्छ, किनकि ठूलो नाफाको आशा कम हुन्छ।
बजारको तरलता: किनबेच कम हुने भएकाले तरलता घट्न सक्छ।
कम्पनीको मूल्याङ्कन: स्टकको मूल्य स्थिर रहँदा कम्पनीको वास्तविक मूल्य झल्किन गाह्रो हुन्छ।
प्राविधिक व्यापारी: साइडवेजमा प्राविधिक विश्लेषण (Technical Analysis) गर्नेहरूले छोटो अवधिको फाइदा लिन सक्छन्।
साइडवेजको महत्व र भूमिका
साइडवेज बजारको एउटा महत्वपूर्ण भूमिका भनेको यो "सन्तुलनको अवस्था" हो। यो बजारको ठूलो उछाल (Bull Market) वा ठूलो गिरावट (Bear Market) को तयारीको चरण पनि हुन सक्छ। बजारले साइडवेजको समयमा शक्ति सञ्चय गर्छ र कुनै ठूलो ट्रिगर पर्खिरहेको हुन्छ। यो समय लगानीकर्तालाई आफ्नो रणनीति पुनर्विचार गर्न, बजार अध्ययन गर्न, र भविष्यको ठूलो चालको लागि तयार रहन सहयोग गर्छ।
साइडवेज कसरी थाहा पाउने?
साइडवेज बजार पहिचान गर्न निम्न संकेतहरू हेर्न सकिन्छ:
Support र Resistance: मूल्य बारम्बार एउटै न्यूनतम र अधिकतम बिन्दुमा ठोक्किन्छ।
कम भोल्युम: ट्रेडिङ भोल्युम (Trading Volume) कम हुन्छ।
Bollinger Bands: यो प्राविधिक सूचक संकुचित (Narrow) हुँदा साइडवेजको संकेत गर्छ।
Moving Average: छोटो र लामो अवधिको Moving Average एकअर्कासँग नजिक वा समानान्तर देखिन्छ।
क्यान्डल व्यवहार: सानो साइजका क्यान्डलहरूको बाहुल्य हुन्छ।
साइडवेजमा क्यान्डलको व्यवहार
साइडवेज बजारमा क्यान्डलस्टिक चार्टको व्यवहारले धेरै कुरा बताउँछ:
Doji Candles: यी क्यान्डलहरूले किनबेचको सन्तुलन देखाउँछन्। साइडवेजमा Doji बारम्बार देखिन्छ।
सानो शरीर भएका क्यान्डल: मूल्यको उतारचढाव कम हुने भएकाले क्यान्डलको शरीर (Body) सानो हुन्छ।
लामो छाया (Wicks): कहिलेकाहीँ क्यान्डलको माथि वा तल लामो छाया देखिन्छ, जसले Support वा Resistance मा ठोक्किएको संकेत गर्छ।
Hammer र Shooting Star: यी क्यान्डलहरूले साइडवेजको अन्त्य र नयाँ ट्रेन्डको सुरुवातको संकेत दिन सक्छन्।
कन्सोलिडेसन: क्यान्डलहरू एकअर्कासँग नजिक-नजिक देखिन्छन्, जसले बजारको स्थिरता देखाउँछ।
साइडवेजबाट कसरी फाइदा लिने?
साइडवेज बजारमा फाइदा लिन लगानीकर्ताले निम्न रणनीति अपनाउन सक्छन्:
Range Trading: Support मा किनेर Resistance मा बेच्ने।
Option Trading: साइडवेजमा "Straddle" वा "Strangle" जस्ता रणनीति प्रयोग गर्न सकिन्छ।
धैर्य राख्ने: ठूलो ब्रेकआउटको प्रतीक्षा गर्नु र त्यसपछि ठूलो कदम चाल्नु।
प्राविधिक सूचक प्रयोग: RSI, MACD, र Bollinger Bands जस्ता सूचकले साइडवेजको सीमा र ब्रेकआउटको संकेत दिन्छ।
सानो नाफामा सन्तुष्टि: ठूलो नाफाको आशा नगरी सानो-सानो फाइदा संकलन गर्ने।
साइडवेजको उदाहरण र विश्लेषण
मानौं, नेपाल स्टक एक्सचेन्ज (NEPSE) मा कुनै स्टकको मूल्य ३०० देखि ३२० को बीचमा २ महिनासम्म घुमिरहन्छ। यो अवधिमा Support ३०० मा र Resistance ३२० मा देखिन्छ। क्यान्डलहरू साना हुन्छन्, र भोल्युम पनि कम रहन्छ। यदि कुनै ठूलो समाचार (जस्तै ब्याजदर घट्ने घोषणा) आयो भने यो साइडवेज टुट्न सक्छ र मूल्य माथि वा तल जान सक्छ। यस्तो अवस्थामा लगानीकर्ताले Support मा किनेर Resistance मा बेच्दै फाइदा लिन सक्छन्।
साइडवेजको अन्त्य कसरी थाहा पाउने?
साइडवेजको अन्त्य निम्न संकेतहरूबाट थाहा हुन्छ:
भोल्युममा वृद्धि: अचानक ट्रेडिङ भोल्युम बढ्नु।
ठूलो क्यान्डल: साइडवेजको दायराभन्दा बाहिर जाने ठूलो क्यान्डल देखिनु।
प्राविधिक ब्रेकआउट: Support वा Resistance तोडिनु।
समाचार वा ट्रिगर: ठूलो आर्थिक वा राजनीतिक घटनाले बजारको दिशा बदल्न सक्छ।
साइडवेज बजार स्टक मार्केटको स्वाभाविक चक्रको हिस्सा हो। यो न त पूर्ण रूपमा राम्रो छ, न त पूर्ण रूपमा नराम्रो। यो समय लगानीकर्ताका लागि अवसर र चुनौती दुवै हो। सही प्राविधिक विश्लेषण, धैर्य, र रणनीतिले साइडवेजबाट फाइदा लिन सकिन्छ। क्यान्डलको व्यवहार र बजारको संकेतहरू बुझेर लगानीकर्ताले आफूलाई तयार राख्नुपर्छ, किनकि साइडवेज पछि आउने ठूलो चालले ठूलो नाफा वा नोक्सान दुवै दिन सक्छ।
What Is a Sideways Market, Why and When Does It Occur?
A "sideways" market, also known as a "sideways trend" or "horizontal trend," refers to a phase in the stock market where prices remain relatively stable within a specific range. In this scenario, the stock price neither rises significantly nor falls sharply; instead, it fluctuates between a defined support (lower limit) and resistance (upper limit). This phenomenon can be described as a period of "market consolidation" or "lateral movement."
A sideways market typically occurs when there’s a lack of significant news, economic events, or policy changes that could drive the market in a clear direction. It’s a neutral phase where the market seems to "pause" before deciding its next move. This can happen at various times, such as before the release of major corporate earnings, during periods of policy uncertainty, or amid global economic ambiguity. The timing depends on market conditions and investor sentiment.
Why Does a Sideways Market Happen?
Several factors contribute to a sideways trend:
Investor Uncertainty: When investors are unsure about the market’s future direction, they hesitate to make large buy or sell decisions, keeping prices stable.
Economic Stability: If the economy shows no major fluctuations—stable interest rates, inflation, or employment—there’s little momentum to push prices up or down.
Technical Influence: Many traders use support and resistance levels. When prices hit these levels, buying and selling balance out, creating a sideways pattern.
Lack of Catalysts: Without major news or events, the market lacks the momentum to establish a trend.
Is It Good or Bad for the Market?
Whether a sideways market is good or bad depends on the perspective and strategy of the investor:
Positive Aspects:
Stability: It reduces volatility, offering a safer environment for new investors to learn.
Opportunity: Experienced traders can profit from small price swings within the range.
Lower Risk: The chance of significant losses is minimized.
Negative Aspects:
Limited Profits: Large price gains are unlikely, capping potential returns.
Boredom: Prolonged sideways movement can reduce investor interest.
Uncertainty: The duration of this phase is unpredictable, making planning difficult.
Impact of a Sideways Market
A sideways market affects various aspects:
Investor Psychology: Traders must exercise patience, as quick profits are rare.
Market Liquidity: Trading volume often decreases, reducing liquidity.
Company Valuation: Stable prices may obscure a company’s true value.
Technical Traders: Those using technical analysis can exploit short-term opportunities within the range.
Role and Importance of a Sideways Market
The sideways phase plays a critical role as a "balancing act" in the market. It often serves as a preparatory stage before a major upward (bull) or downward (bear) trend. During this period, the market gathers momentum, waiting for a catalyst to break out. For investors, it’s a time to reassess strategies, study the market, and prepare for the next big move. Its importance lies in providing a breather amid volatile cycles, allowing participants to strategize effectively.
How to Identify a Sideways Market?
Recognizing a sideways trend involves observing key indicators:
Support and Resistance: Prices repeatedly bounce between a consistent low and high.
Low Volume: Trading volume drops as activity slows.
Bollinger Bands: These bands narrow, signaling reduced volatility.
Moving Averages: Short- and long-term moving averages converge or run parallel.
Candlestick Behavior: Small-sized candles dominate the chart.
Candlestick Behavior in a Sideways Market
Candlestick patterns provide valuable insights into a sideways market:
Doji Candles: These indicate indecision, with buyers and sellers in equilibrium—a common sight in sideways trends.
Small-Bodied Candles: Limited price movement results in candles with small bodies.
Long Wicks: Candles may have extended upper or lower shadows, showing tests of support or resistance.
Hammer and Shooting Star: These patterns can signal the end of a sideways phase and the start of a new trend.
Consolidation: Candles cluster closely together, reflecting market stability.
How to Profit from a Sideways Market?
Investors can capitalize on a sideways market with these strategies:
Range Trading: Buy at support and sell at resistance to profit from predictable swings.
Options Trading: Use strategies like "Straddle" or "Strangle" to benefit from low volatility.
Patience: Wait for a breakout and position yourself for the subsequent trend.
Technical Indicators: Tools like RSI, MACD, and Bollinger Bands help identify range limits and potential breakouts.
Small Gains: Focus on accumulating modest profits rather than expecting large windfalls.
Example and Analysis
Imagine a stock on the Nepal Stock Exchange (NEPSE) trading between 300 and 320 for two months. The support is at 300, and resistance is at 320. During this period, candlesticks are small, and volume is low. If a major event—like an interest rate cut—is announced, the sideways trend might break, pushing the price upward or downward. Traders could buy at 300 and sell at 320 repeatedly, securing steady profits within the range.
How to Know When a Sideways Market Ends?
The end of a sideways trend is marked by these signals:
Volume Surge: A sudden increase in trading volume suggests momentum is building.
Large Candles: A candlestick breaking beyond the range indicates a shift.
Technical Breakout: Price breaches support or resistance with conviction.
News Trigger: A significant economic or political event can jolt the market into a new direction.
A sideways market is a natural part of the stock market cycle. It’s neither inherently good nor bad—it’s a phase of opportunity and challenge. With the right technical analysis, patience, and strategy, investors can profit from it. Understanding candlestick behavior and market signals is key to navigating this phase. While it may test your patience, the sideways trend often precedes a significant move, offering the potential for substantial gains or losses. Preparing during this period ensures you’re ready when the market finally chooses its path.


