Top
Anatomy of a Short Sale: A Visual Guide to Market Reversals
Anatomy of a Short Sale: A Visual Guide to Market Reversals The AI-enhanced infographic titled “Anatomy of a Short Sale” presents a modern and visually engaging explanation of how market tops are formed and how traders can identify profitable short-selling opportunities. Designed with a professional trading theme, the chart combines technical patterns, volume analysis, and moving averages to illustrate the complete lifecycle of a market reversal. At the beginning of the chart, the Initial First-Stage Base Breakout marks the start of an upward trend. During this phase, price rises from a consolidation zone and moves above the 50-Day Moving Average, signaling growing bullish momentum. This stage often attracts retail investors and fuels optimism in the market.
Dipesh Ghimire
2 min read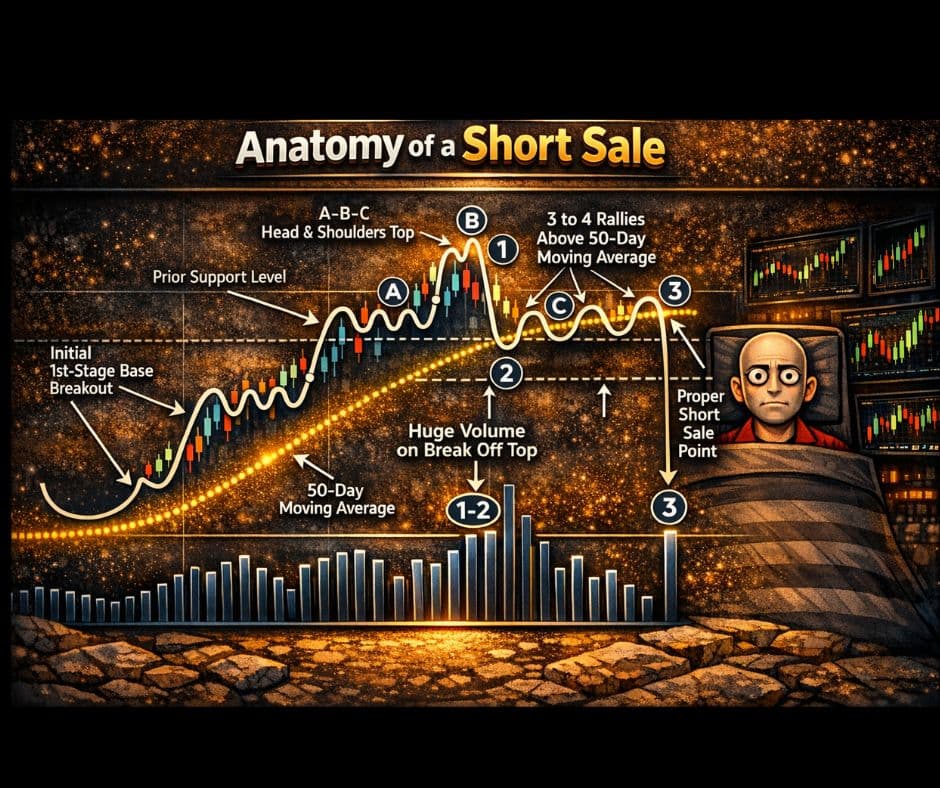
The AI-enhanced infographic titled “Anatomy of a Short Sale” presents a modern and visually engaging explanation of how market tops are formed and how traders can identify profitable short-selling opportunities. Designed with a professional trading theme, the chart combines technical patterns, volume analysis, and moving averages to illustrate the complete lifecycle of a market reversal.
At the beginning of the chart, the Initial First-Stage Base Breakout marks the start of an upward trend. During this phase, price rises from a consolidation zone and moves above the 50-Day Moving Average, signaling growing bullish momentum. This stage often attracts retail investors and fuels optimism in the market.
As the uptrend matures, the chart forms the classic A-B-C Head and Shoulders Pattern. Point A represents the left shoulder, Point B forms the highest peak (the head), and Point C creates the right shoulder. This structure indicates weakening buying pressure and growing distribution by institutional traders.
A crucial element in the diagram is the Neckline, which acts as a key support level. When price breaks below this line with strong volume, it confirms the end of the bullish trend. The chart highlights Huge Volume on the Break of the Top, showing that large investors are exiting their positions during this phase.
The infographic also displays Three to Four Failed Rallies Above the 50-Day Moving Average. These rallies often mislead traders into believing the uptrend will continue. In reality, they represent weak recovery attempts before the final decline.
The Proper Short Sale Point is clearly marked after price retests resistance and fails to recover above the neckline. This is where experienced traders typically enter short positions, as risk is minimized and confirmation is strongest.
Volume analysis at the bottom of the chart further supports the setup. Rising volume during price declines and falling volume during rebounds confirm strong selling pressure and weak buyer interest. This relationship strengthens the reliability of the pattern.
Overall, the AI-enhanced visual emphasizes disciplined trading over emotional decision-making. It encourages traders to rely on structure, confirmation, and risk management rather than speculation.
In today’s highly volatile global markets, such technical frameworks are essential for both professional and retail traders. The “Anatomy of a Short Sale” serves as a reminder that market reversals follow identifiable patterns—and understanding them can help traders protect capital and generate consistent returns.
Advertisement
Written by
Dipesh Ghimire