Top
Top
Stock
Trading
Dipesh Ghimire
Consumer Price Index Analysis: Food and Beverage Prices Lead Inflation Across Nepal's Ecological Belts
Consumer Price Index Analysis: Food and Beverage Prices Lead Inflation Across Nepal's Ecological Belts The latest Consumer Price Index (CPI) data, based on the fiscal year 2023/24 as the base, reveals significant trends across Nepal's ecological belts. The CPI highlights changes in the cost of goods and services in Kathmandu Valley, Terai, Hill, and Mountain regions, with notable price increases in the Food and Beverage category driving inflation.
Dipesh Ghimire
2 min read
The latest Consumer Price Index (CPI) data, based on the fiscal year 2023/24 as the base, reveals significant trends across Nepal's ecological belts. The CPI highlights changes in the cost of goods and services in Kathmandu Valley, Terai, Hill, and Mountain regions, with notable price increases in the Food and Beverage category driving inflation.
Overall Index
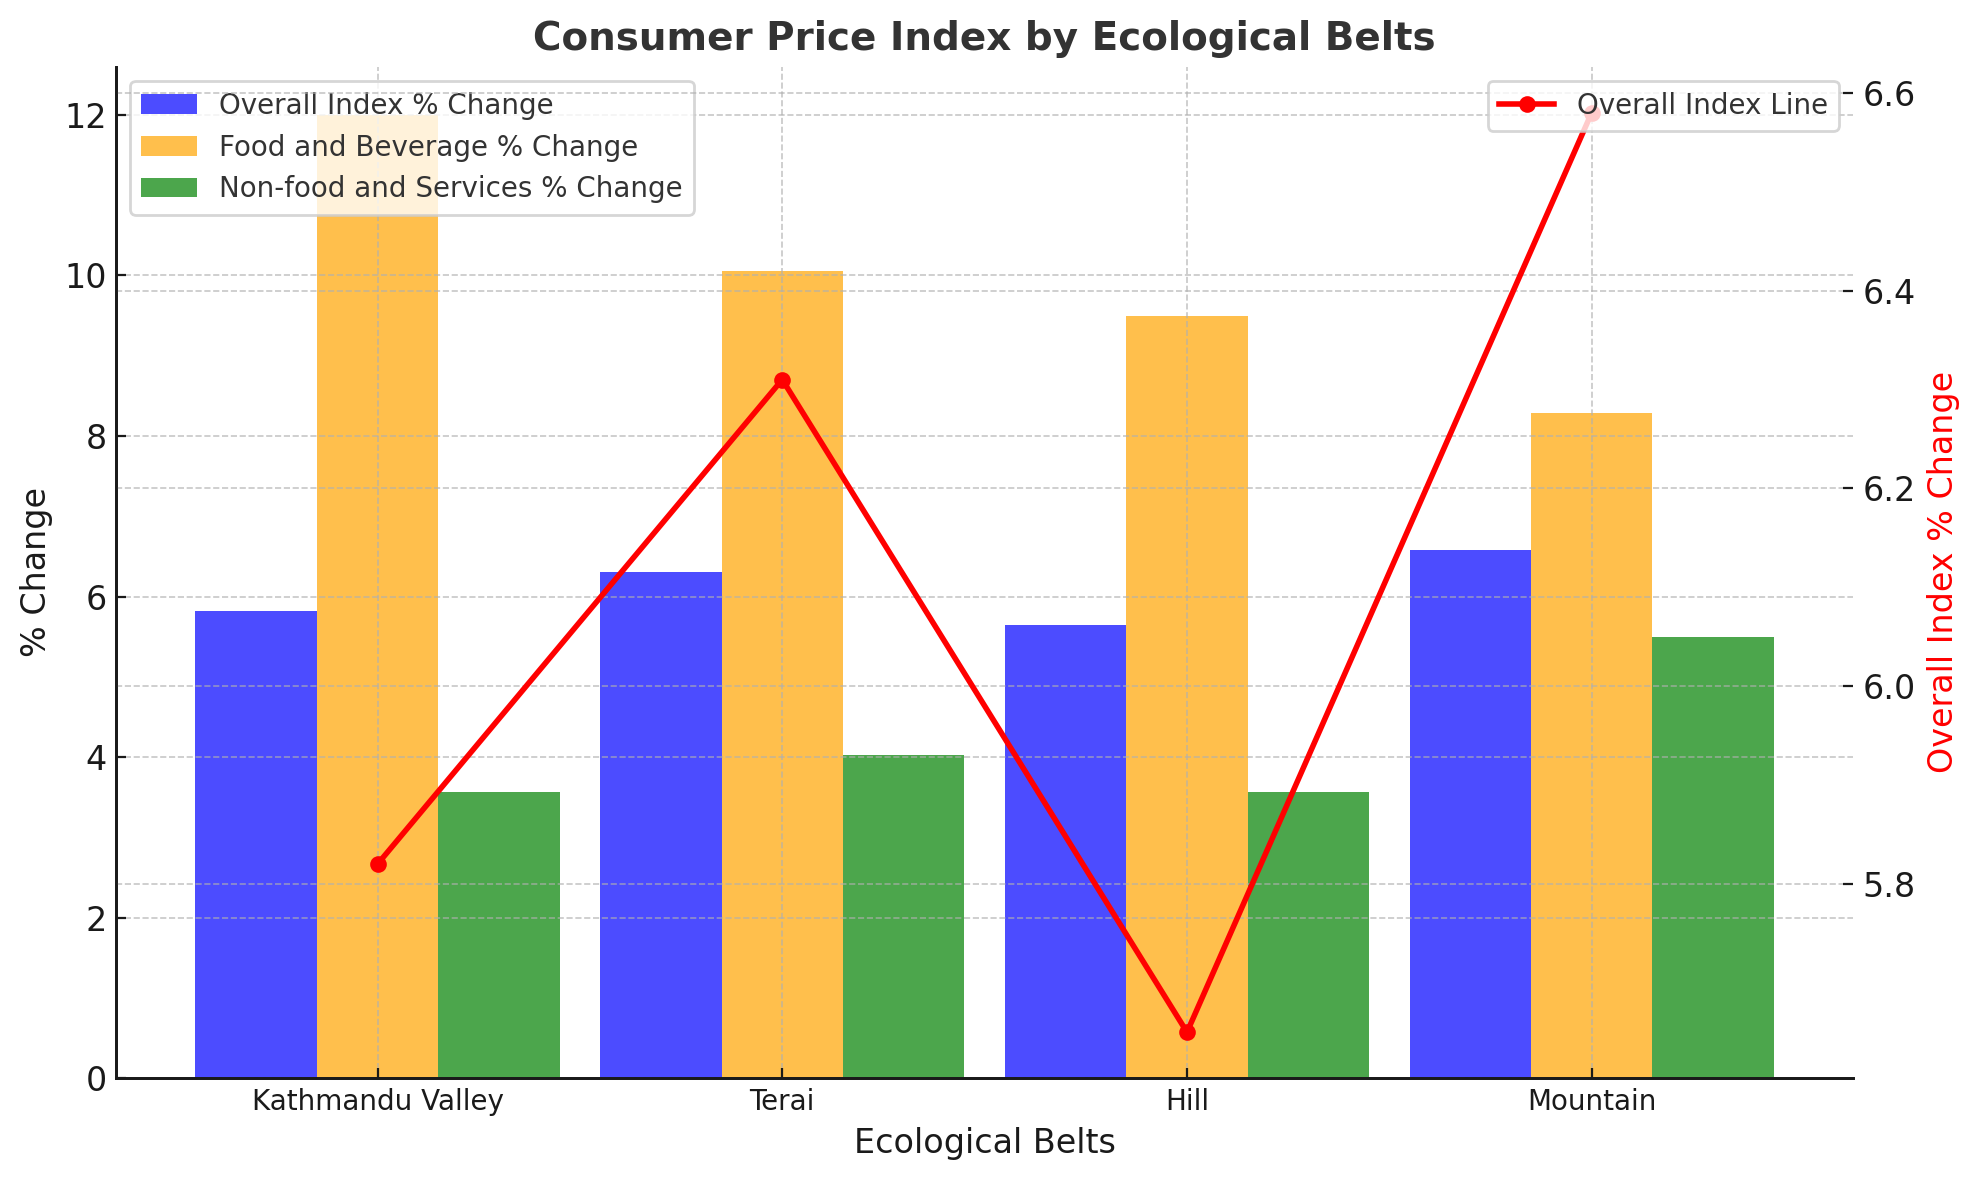
The overall CPI index increased by 6.05% year-over-year, reflecting broad-based inflation across all ecological belts. However, on a monthly basis (Nov/Dec compared to Oct/Nov 2024/25), the index saw a slight decline of 0.39%, indicating short-term stabilization in prices.
Kathmandu Valley
Year-over-year: The overall CPI rose by 5.82%, while Food and Beverage prices surged by an alarming 12.00%, the highest increase among all regions. Non-food and Services prices saw a modest rise of 3.57%.
Interpretation: The sharp increase in food prices may be attributed to supply chain constraints and increased transportation costs in the capital region.
Terai
Year-over-year: The CPI increased by 6.31%, with Food and Beverage prices growing by 10.05%, while Non-food and Services rose by 4.02%.
Interpretation: Terai's agricultural dependency and proximity to border trade suggest that fluctuating food prices are likely influenced by seasonal factors and import costs.
Hill
Year-over-year: The overall index increased by 5.65%, with Food and Beverage prices up by 9.50%, and Non-food and Services prices by 3.56%.
Interpretation: The Hill region’s inflation is moderate compared to Terai but still reflects the impact of rising food costs, driven by limited access to markets and reliance on imports for staple goods.
Mountain
Year-over-year: The CPI showed the highest overall increase at 6.58%, with Food and Beverage prices growing by 8.28% and Non-food and Services by 5.50%.
Interpretation: Transportation challenges and harsher climatic conditions in the Mountain region amplify the cost of both food and non-food items, contributing to sustained inflation.
The data underscores a common trend across all ecological belts: Food and Beverage prices are the primary driver of inflation, rising between 8.28% (Mountain) and 12.00% (Kathmandu Valley). Non-food and Services prices have remained relatively stable, indicating controlled inflation in other sectors.
Impact on Kathmandu Valley: The steep rise in food prices could strain household budgets, especially for low-income families, and might require targeted subsidies or market interventions to stabilize costs.
Regional Disparities: The Mountain region faces the highest inflation due to its geographic isolation and logistical challenges. Policies aimed at improving connectivity and reducing transportation costs could alleviate price pressures.
Outlook: While the year-over-year increase highlights persistent inflation, the slight monthly decline suggests a potential stabilization of prices in the short term. However, continued monitoring is essential, especially as global economic uncertainties and fuel prices could impact Nepal’s import-dependent economy.
The CPI data highlights a pressing need for policymakers to address food price inflation, which disproportionately affects vulnerable populations. Strengthening agricultural supply chains, improving storage facilities, and promoting local production could help mitigate future price surges. As Nepal navigates these challenges, balancing inflation control with economic growth remains a critical priority.
Advertisement
Written by
Dipesh Ghimire