NEPSE
NEPSE Experiences Point Decline, Yet Surge in Turnover Signals Investor Accumulation
Looking ahead, technical chart analysis reveals that the market is currently hovering in a highly critical zone. The formation of a continuous 'Lower High' and 'Lower Low' sequence on the chart suggests the market is navigating a short-term correction phase. With NEPSE resting at 2618, the immediate and crucial support level lies around the 2602 mark. The market is highly likely to test this support in the coming week. If this level fails to hold, technical indicators warn of a further slide toward the 2546 zone. Nevertheless, the elevated trading volume during this bearish stretch implies that 'smart money' may be accumulating positions near the support line. Technical analysts suggest that if the market manages to sustain the 2602 support and bounce back, it will face initial resistance at 2673, followed by a stronger hurdle at the 2754 level.
Dipesh Ghimire
2 min read
Kathmandu — Despite a moderate decline in the benchmark NEPSE index this week, the domestic stock market witnessed a notable surge in trading activity and investor enthusiasm. Over the trading week, the index contracted by nearly 1 percent to close at 2618.72. Compared to last week's close of 2643.83, the market shed 25.11 points (0.95 percent). Out of the five active trading days, the market remained in the red for four days and managed to close green on just one. In tandem with the broader market, the Float Index fell by 3.37 points, the Sensitive Index by 2.00 points, and the Sensitive Float Index by 1.21 points.
While the index followed a corrective path, market liquidity and buying fervor painted a different picture. The average daily turnover, which stood at Rs. 3.86 billion last week, jumped by 16.30 percent to Rs. 4.49 billion this week. Similarly, the daily average number of traded shares and transaction counts increased by 14.19 percent and 10.08 percent, respectively. This spike in turnover amidst a falling market strongly suggests that investors are actively accumulating shares at lower price levels. However, the overall decline did dent investor wealth, with total market capitalization shrinking by Rs. 43 billion to settle at Rs. 4,504 billion.
A sectoral analysis reveals that 11 out of the 13 sub-indices ended the week in negative territory, leaving only two sectors to offer a slight reprieve to investors. The Trading and Manufacturing & Processing sub-indices gained 0.41 percent and 0.11 percent, respectively. On the losing end, the Finance sector recorded the steepest percentage drop of 2.37 percent (56.21 points), while Life Insurance suffered the highest absolute drop, shedding 210.41 points. Supply in the secondary market also expanded this week following the listing of a combined 3,689,681.11 bonus and right shares from Salt Trading Corporation, Sanima GIC, and United Ajod Insurance.
Despite the broader market downturn, some individual scripts delivered massive returns. Sarbottam Paints emerged as the undisputed top gainer, with its stock price skyrocketing by 101.06 percent—from Rs. 396.70 to Rs. 797.06. Mount Everest Power Development also saw an impressive surge of over 69 percent. Conversely, investors in Khani Khola Hydropower faced the heaviest losses, with the stock plunging 23.39 percent, while ICFC Finance's debenture also fell by 14 percent. A deep dive into the floorsheet data indicates that Nepal Telecom, Sarbottam Paints, and Laxmi Sunrise Bank were the most popular buy-side stocks, whereas Modi Energy, Swarojgar Laghubitta, and Manakamana Engineering faced significant selling pressure.
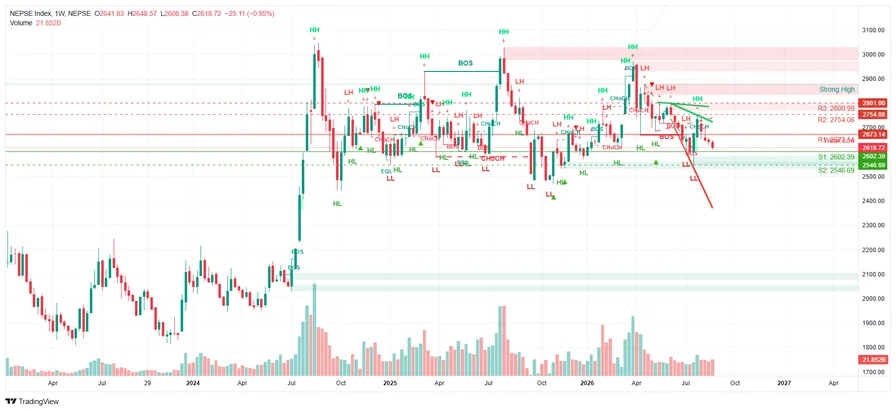
Looking ahead, technical chart analysis reveals that the market is currently hovering in a highly critical zone. The formation of a continuous 'Lower High' and 'Lower Low' sequence on the chart suggests the market is navigating a short-term correction phase. With NEPSE resting at 2618, the immediate and crucial support level lies around the 2602 mark. The market is highly likely to test this support in the coming week. If this level fails to hold, technical indicators warn of a further slide toward the 2546 zone. Nevertheless, the elevated trading volume during this bearish stretch implies that 'smart money' may be accumulating positions near the support line. Technical analysts suggest that if the market manages to sustain the 2602 support and bounce back, it will face initial resistance at 2673, followed by a stronger hurdle at the 2754 level.
Advertisement
Written by
Dipesh Ghimire