NEPSEtrading

Make smarter moves backed by machine learning. Join thousands of traders leveraging AI to maximize profits.

nepsetrading.com is an online news portal that provides insights into trading and investment by analyzing the stock market and the global economy. We create charts based on the analysis of various indicators. Please do not rely solely on this information for investment decisions. Self-study is crucial. Use this information only as an educational and informational resource.

Marketminds Investment Group Private Limited

DOIB Registration certificate no. :

4680-2081/2082

Chairman: Bishal Bikram Bimali

Director and Editor-in-chief:

Dipesh Ghimire

(

9802363868,

9851119988

)

Koteshwor 32 , Kathmandu

01-5253221

+977 9709066745

Contact support

Subscribe to our newsletter

Weekly insights from the NEPSE market in your inbox.

Market

StocksSectors

Company

About UsOur TeamTerms of UseOur PolicyTrainingContact Us

Help

SupportReportFAQ

© 2026 nepsetrading.com. All rights reserved.
This website is owned and operated by Marketminds Investment Group Private Limited.

Charts are powered byTrading View

NEPSEtrading

  • Home
  • Market
  • Charts
  • News
  • Blogs
  • Training
  • Pricing
  1. Blogs
  2. nepse
  3. NEPSE Index Analysis: Short-Term Bearish Trend with High Trading Volume
nepse

NEPSE Index Analysis: Short-Term Bearish Trend with High Trading Volume

In summary, the NEPSE index is showing a short-term bearish trend after a strong upward movement, with the current price dipping below the middle Bollinger Band. The high volume indicates significant trading interest, which could lead to increased volatility. Monitoring the price action around the middle and lower Bollinger Bands will be crucial for the next trading sessions.

SCSandeep Chaudhary
Published on May 30, 20241 min read
NEPSE Index Analysis: Short-Term Bearish Trend with High Trading Volume

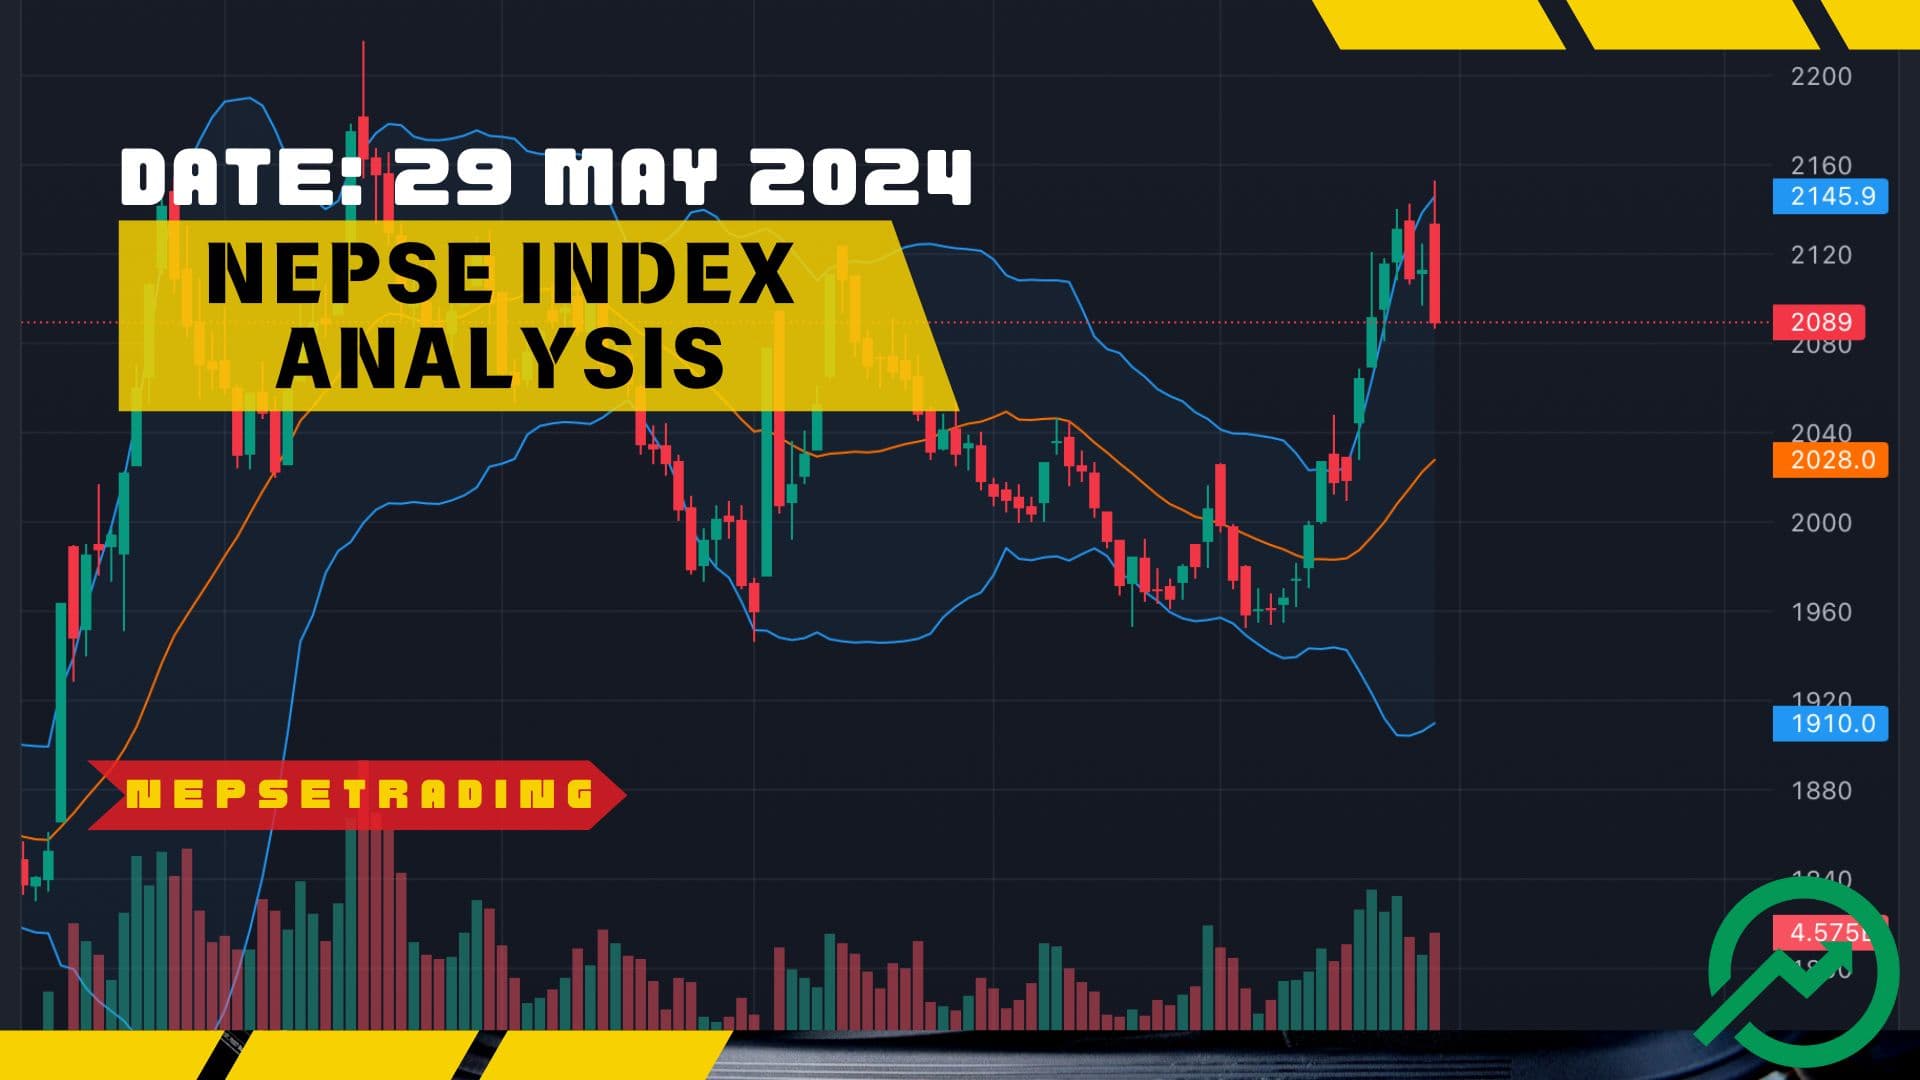
The NEPSE index is showing a short-term bearish trend after a strong upward movement, with the current price dipping below the middle Bollinger Band. The high volume indicates significant trading interest, which could lead to increased volatility. Monitoring the price action around the middle and lower Bollinger Bands will be crucial for the next trading sessions.

  1. Current Price Position: The NEPSE index closed at 2089, down by 24 points (1.13%). The candlestick shows a red candle, indicating a decline for the day.

  2. Bollinger Bands: The Bollinger Bands are set with a period of 20 and a standard deviation of 2. The upper band is at 2145.9, and the lower band is at 1910.0, with the middle band (20-day moving average) at 2028.0. The current price is near the middle band but has fallen below it, suggesting a potential reversion to the mean if the trend continues downward.

  3. Volume: The trading volume for the day is 4.575 billion, indicating relatively high activity.

  4. Trend Analysis:

    • Resistance and Support Levels: The upper band at 2145.9 acts as a resistance level, while the lower band at 1910.0 acts as support.

    • Recent Movement: The recent upward trend was strong, but the last two days show a pullback, indicating that the momentum might be slowing down or reversing.

  5. Technical Indicators:

    • Middle Band (Moving Average): The price crossing below the middle band (2028.0) can be a bearish signal, indicating that the index might continue to move downwards if it doesn't recover soon.

    • Candlestick Patterns: Look for candlestick patterns that might indicate reversals, such as doji, hammer, or engulfing patterns around these key levels.

SC

Written by

Sandeep Chaudhary

NEPSE Index Analysis: Short-Term Bearish Trend with High Trading Volume

Related News

View all
  • Tourism Earnings Slip While Education Spending Abroad Climbs: Nepal's Services Account Remains in Deficit at Rs.68 Billion
    Nepal’s Economy

    Tourism Earnings Slip While Education Spending Abroad Climbs: Nepal's Services Account Remains in Deficit at Rs.68 Billion

    10 Jun, 2026

  • Nepal's Terms of Trade Deteriorate by 16.9 Percent: Import Prices Surge 24 Percent While Export Prices Crawl at 3.1 Percent
    Nepal’s Economy

    Nepal's Terms of Trade Deteriorate by 16.9 Percent: Import Prices Surge 24 Percent While Export Prices Crawl at 3.1 Percent

    10 Jun, 2026

  • Trade Deficit Crosses Rs.1,443 Billion: Exports Grow But Imports Outpace Them, China-Bound Exports Collapse by 41 Percent
    Nepal’s Economy

    Trade Deficit Crosses Rs.1,443 Billion: Exports Grow But Imports Outpace Them, China-Bound Exports Collapse by 41 Percent

    10 Jun, 2026

Related News