Top
New Trading Week Begins Today: NEPSE Starts at 2,758, Both Budget and Resistance Levels Under Test
Analysts suggest that investors should adopt a cautious strategy, focusing on the technical structure of "Strong" and "Moderate" category companies rather than getting carried away by single-day spikes. The test of both the budget and the resistance level begins today.
Dipesh Ghimire
5 min read
The NEPSE index, which closed at 2,758.49 points on Friday after gaining 26.55 points on a weekly basis, opens its new trading week today, Sunday. This week's trading session is no ordinary one for investors — on one hand, the index has approached its first resistance level, and on the other, anticipation is building for the upcoming budget for fiscal year 2083/84.
Of the five trading days last week, the index declined on three and rose on two. After dropping 1.03 points on Monday and 6.51 points on Tuesday to reach 2,724.39, the index climbed 30.08 points on Wednesday to 2,754.48. Although it slipped 12.36 points on Thursday, Friday brought a 16.38-point gain, closing the market at the week's high. The previous week had ended at 2,731.94 points.
What Did Friday's Bullish Candle Signal?
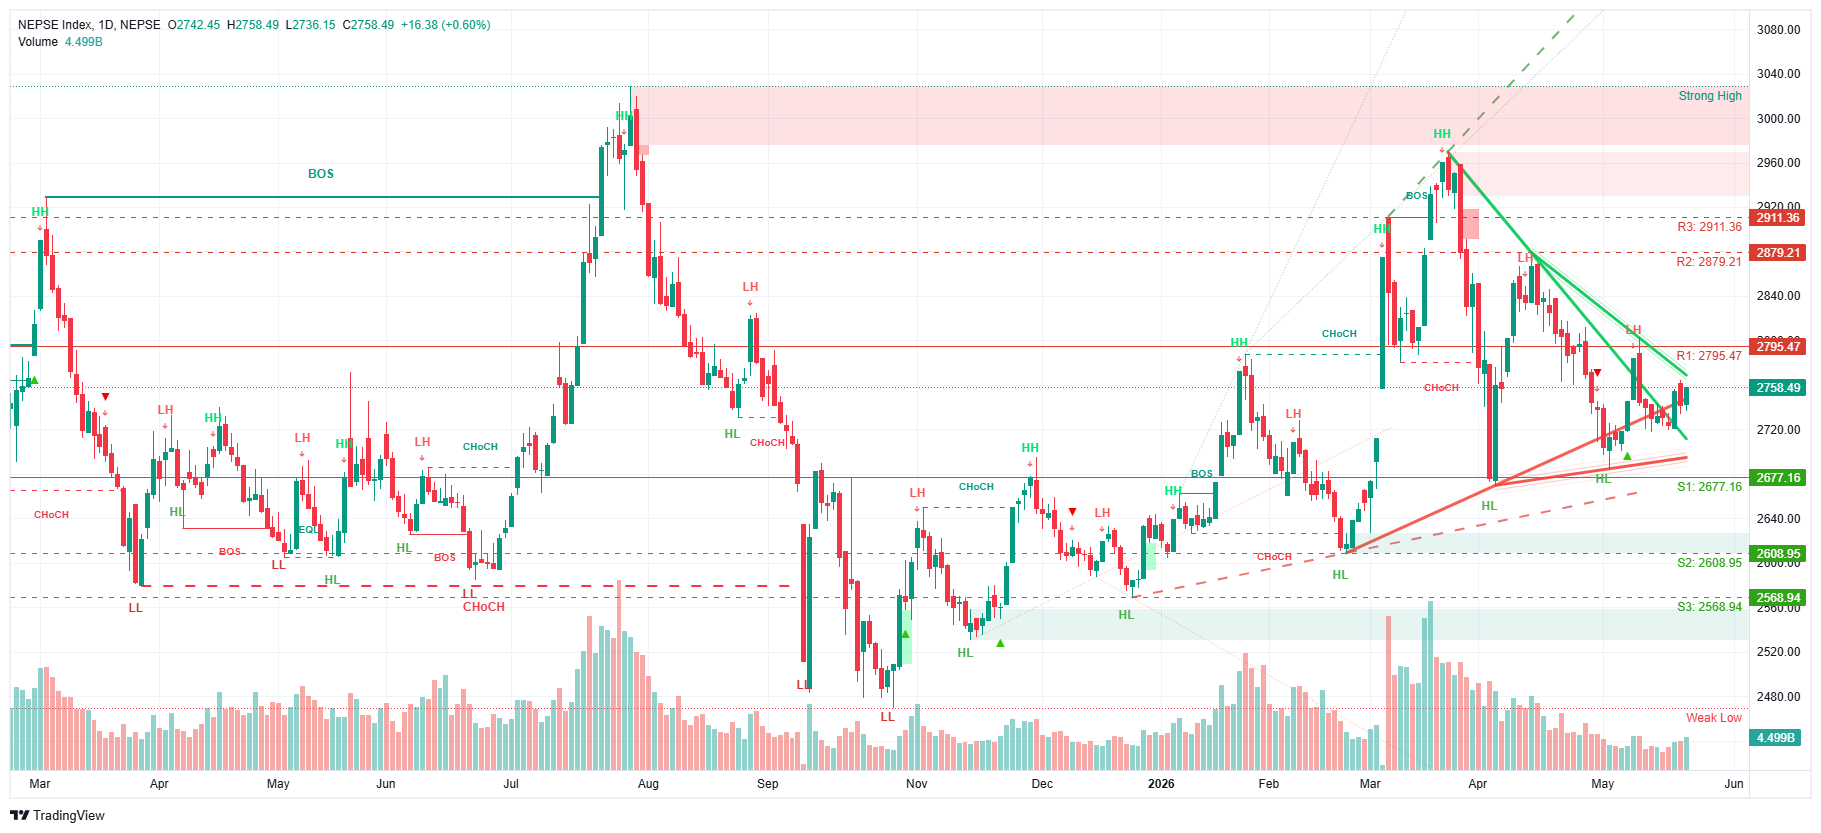
On the technical chart, Friday's trading session is being viewed as a "bullish candle." The index opened at 2,742.45, initially dropped to 2,736.15, but buying pressure picked up toward the close, pushing the index to its daily high of 2,758.49 — where it also closed. Technical analysts say a close equal to the daily high indicates weakness on the seller's side.
The first resistance level on the technical chart sits at 2,795.47 points. If this level is breached, the next resistance levels are 2,879.21 and 2,911.36. On the support side, the first level is at 2,677.16, followed by 2,608.95 and 2,568.94. Since the index currently sits roughly midway between the first resistance and first support, today's trading is expected to determine the short-term direction.
The Smart Money Concept (SMC) is also showing an interesting structure. After the index touched 2,960 in late April to form a "Strong High," the market saw its first sign of a trend reversal — a "Change of Character." Subsequent "Lower Highs" formed in succession, but in mid-May, the index established a "Higher Low" around the 2,710 zone. Analysts interpret this structure as a sign of weakening selling pressure and the return of buyers.
But Trading Volume Hasn't Confirmed It Yet
Looking at the weekly chart, trading volume has not risen meaningfully alongside the index. Friday did see the week's highest turnover of Rs 4.49 billion, with 10.88 million shares of 336 companies changing hands. However, volume tapered through the middle of the week, suggesting that strong buyer enthusiasm has yet to return. Market capitalization, meanwhile, climbed past Rs 4.7 trillion — closing at Rs 4.704 trillion this week, up from Rs 4.659 trillion the previous Friday.
A Curious Coincidence in Gainers and Losers
Last week's top gainer was Upper Lohore Khola Hydropower, which jumped 15 percent on Wednesday. Curiously, the same company also topped the losers' list the very next day, falling 14.95 percent on Thursday. Crest Microlife rose 14.81 percent on Friday, Corporate Development Bank climbed 14.26 percent on Tuesday, and Ingwa Hydropower added 8.42 percent on Monday. Prabhu Bank's debenture unit gained 6.62 percent. On the losing side, Corporate Development Bank dropped 13.26 percent, City Hotel 6.84 percent, and NIFRA Energy Bond 5.26 percent.
In terms of turnover, Aankhu Khola Hydropower led the week. On Friday alone, it recorded Rs 439.5 million in trading. Corporate Development Bank traded Rs 183.5 million worth of shares on Wednesday, and Sahas Urja Rs 91.6 million on Tuesday.
Sahas Urja Tops the Technical Score
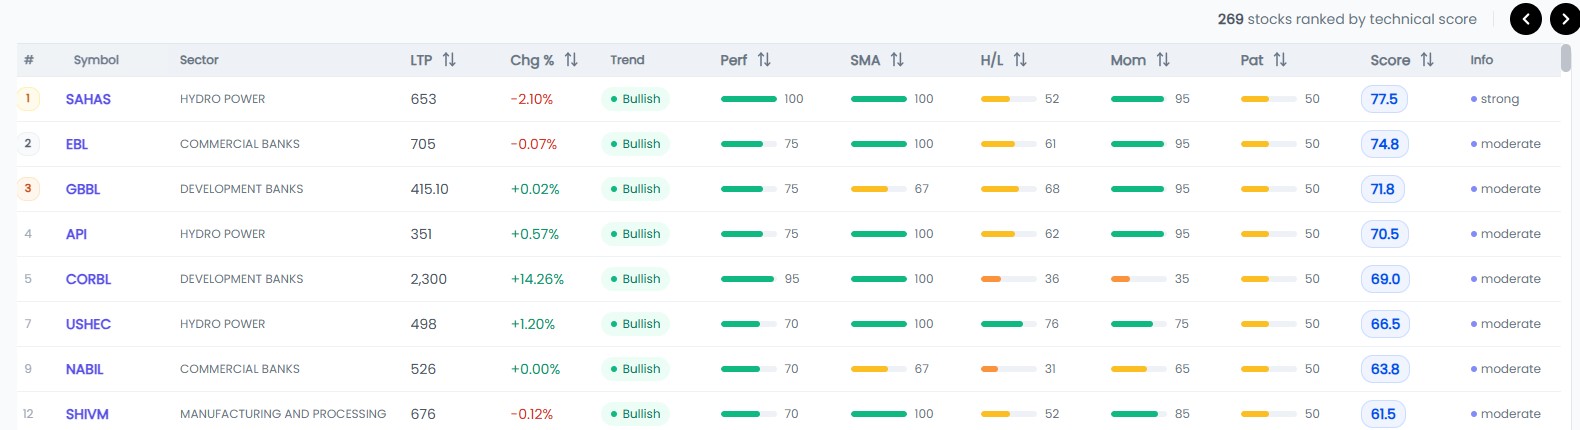
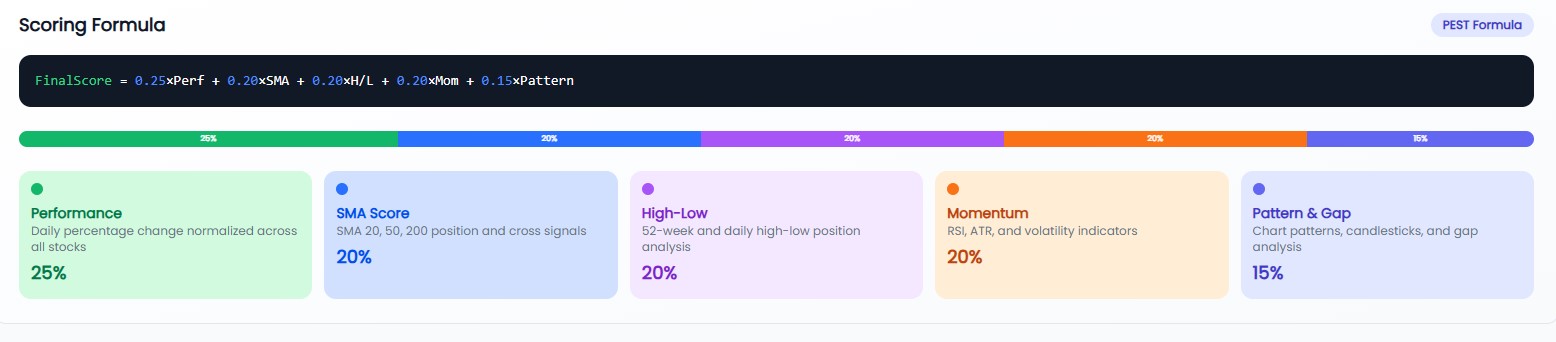
In terms of technical evaluation, Sahas Hydropower has emerged at the top among 269 listed companies. Based on the "PEST Formula," which combines five technical indicators, Sahas earned 77.5 points — the only company in the "Strong" category. All other companies remain in the "Moderate" tier.
Although Sahas's share price fell 2.10 percent to Rs 653, its technical structure remains unaffected. The company scored 100 on the Performance indicator, 100 on the Simple Moving Average (SMA), and 95 on Momentum to retain the top position. Second place went to Everest Bank (74.8 points, share price Rs 705), third to Garima Vikas Bank (71.8 points, Rs 415.10), and fourth to API Power Company (70.5 points, Rs 351).
Fifth-placed Corbl Vikas Bank surged 14.26 percent in a single day to Rs 2,300 but scored only 36 on the High-Low indicator and 35 on Momentum, leaving its overall score capped at 69. This is a clear example of how a single-day spike doesn't strengthen a company's structure. USHEC sits seventh (66.5 points, Rs 498), Nabil Bank ninth (63.8 points, Rs 526), and Shivam Cement twelfth (61.5 points, Rs 676).
Looking at the sectoral breakdown of the top ten, the hydropower sector is dominant. Sahas, API and USHEC — three hydropower companies — have made it into the top seven. While all eight top-ranked companies show a "Bullish" trend and most have an SMA score of 100, the fact that most companies' High-Low scores remain between 52 and 76 indicates that share prices haven't yet reached their 52-week highs.
Budget Watch: Mixed Signals
Amid this technical picture, the upcoming budget for fiscal year 2083/84 from Finance Minister Dr. Swarnim Wagle is expected to influence the market's direction. In his month-and-a-half tenure, Wagle has given clear signals favoring fiscal discipline and a realistic budget. According to him, public debt — which stood at around 25 percent of GDP in 2016 — has now reached 42–43 percent. The government therefore claims the upcoming budget will be built based on actual revenue capacity and spending ability.
This signal could prove to be a double-edged sword for the market. If fiscal discipline is maintained, long-term investor confidence may return. But excessive restraint could shrink development spending and dampen market demand. Wagle has also indicated that large infrastructure projects will move toward Public-Private Partnership (PPP) and Foreign Direct Investment (FDI) models rather than carrying the burden of debt. His position on routing Nijgadh Airport and Budhi Gandaki Hydropower Project away from debt-based financing has raised questions about the investment framework for the hydropower sector — and given hydropower's heavy technical presence on NEPSE, this issue will directly affect the market.
Investor attention is focused on three specific issues — capital gains tax, margin lending policy, and the direction of financial sector reform, including cooperatives. With the government under pressure from weak revenue collection, analysts warn that any new tax introduced in the name of raising revenue could trigger an immediate negative reaction in the market.
Today's trading will set the tone for the new week, and two factors will determine its direction. First — whether the index can deliver a sustained close above 2,795.47. If it does, the next target opens up to 2,879. If it fails to clear that resistance, the chart suggests the index could retreat to the 2,710–2,677 range. Second — how the developing signals around the budget shape investor sentiment.
Friday's bullish candle, the Higher Low structure, and the strong technical scores of companies like Sahas paint a positive picture for the short term. But without volume confirmation, how long this enthusiasm lasts — and what direction the budget sets — are the two questions that will define the story of the coming week.
Analysts suggest that investors should adopt a cautious strategy, focusing on the technical structure of "Strong" and "Moderate" category companies rather than getting carried away by single-day spikes. The test of both the budget and the resistance level begins today.
Advertisement
Written by
Dipesh Ghimire