NEPSEtrading

Make smarter moves backed by machine learning. Join thousands of traders leveraging AI to maximize profits.

nepsetrading.com is an online news portal that provides insights into trading and investment by analyzing the stock market and the global economy. We create charts based on the analysis of various indicators. Please do not rely solely on this information for investment decisions. Self-study is crucial. Use this information only as an educational and informational resource.

Marketminds Investment Group Private Limited

DOIB Registration certificate no.: 4680-2081/2082

Director & Editor-in-chief: Dipesh Ghimire · 9802363868, 9851119988

Koteshwor 32, Kathmandu
01-5253221 · +977 9709066745

Contact support

Subscribe to our newsletter

Weekly insights from the NEPSE market in your inbox.

Get the app

Track markets, signals and alerts from your phone.

Get it onGoogle Play

Market

  • Stocks
  • Sectors

Company

  • About Us
  • Our Team
  • Terms of Use
  • Our Policy
  • Training
  • Contact Us

Help

  • Support
  • Report
  • FAQ

© 2026 nepsetrading.com. All rights reserved.
Owned and operated by Marketminds Investment Group Private Limited.

Charts powered by TradingView

  1. News
  2. Top
  3. Hotel Index Poised for Breakout as Best Buy in Current HL Position
होटल इन्डेक्स HL पोजिसनमा किन्नको लागि उत्कृष्ट, प्रमुख ट्रेन्ड लाइन ब्रेकआउटको सम्भावना
Top
3 min read
Published on March 2, 2025
NepseTrading

होटल इन्डेक्स HL पोजिसनमा किन्नको लागि उत्कृष्ट, प्रमुख ट्रेन्ड लाइन ब्रेकआउटको सम्भावनाHotel Index Poised for Breakout as Best Buy in Current HL Position

होटल्स एन्ड टुरिजम इन्डेक्स (HOTELS_D) वित्तीय बजारमा एक प्रमुख खेलाडीको रूपमा उभिएको छ, जसले लगानीकर्ताहरूको ध्यान आकर्षित गरेको छ। हालको ट्रेडिङ सत्रमा यो इन्डेक्स ६७९० मा बन्द भएको छ, जुन १.१३% को गिरावट हो, तर यसको वर्तमान अवस्थाले प्रमुख ट्रेन्ड लाइनबाट ब्रेकआउटको सम्भावना देखाउँछ, जसले यो इन्डेक्सलाई वृद्धिको अवसर खोज्ने लगानीकर्ताहरूको लागि शीर्ष विकल्प बनाउँछ।

प्राविधिक विश्लेषण: बुलिश सेटअपको तयारी

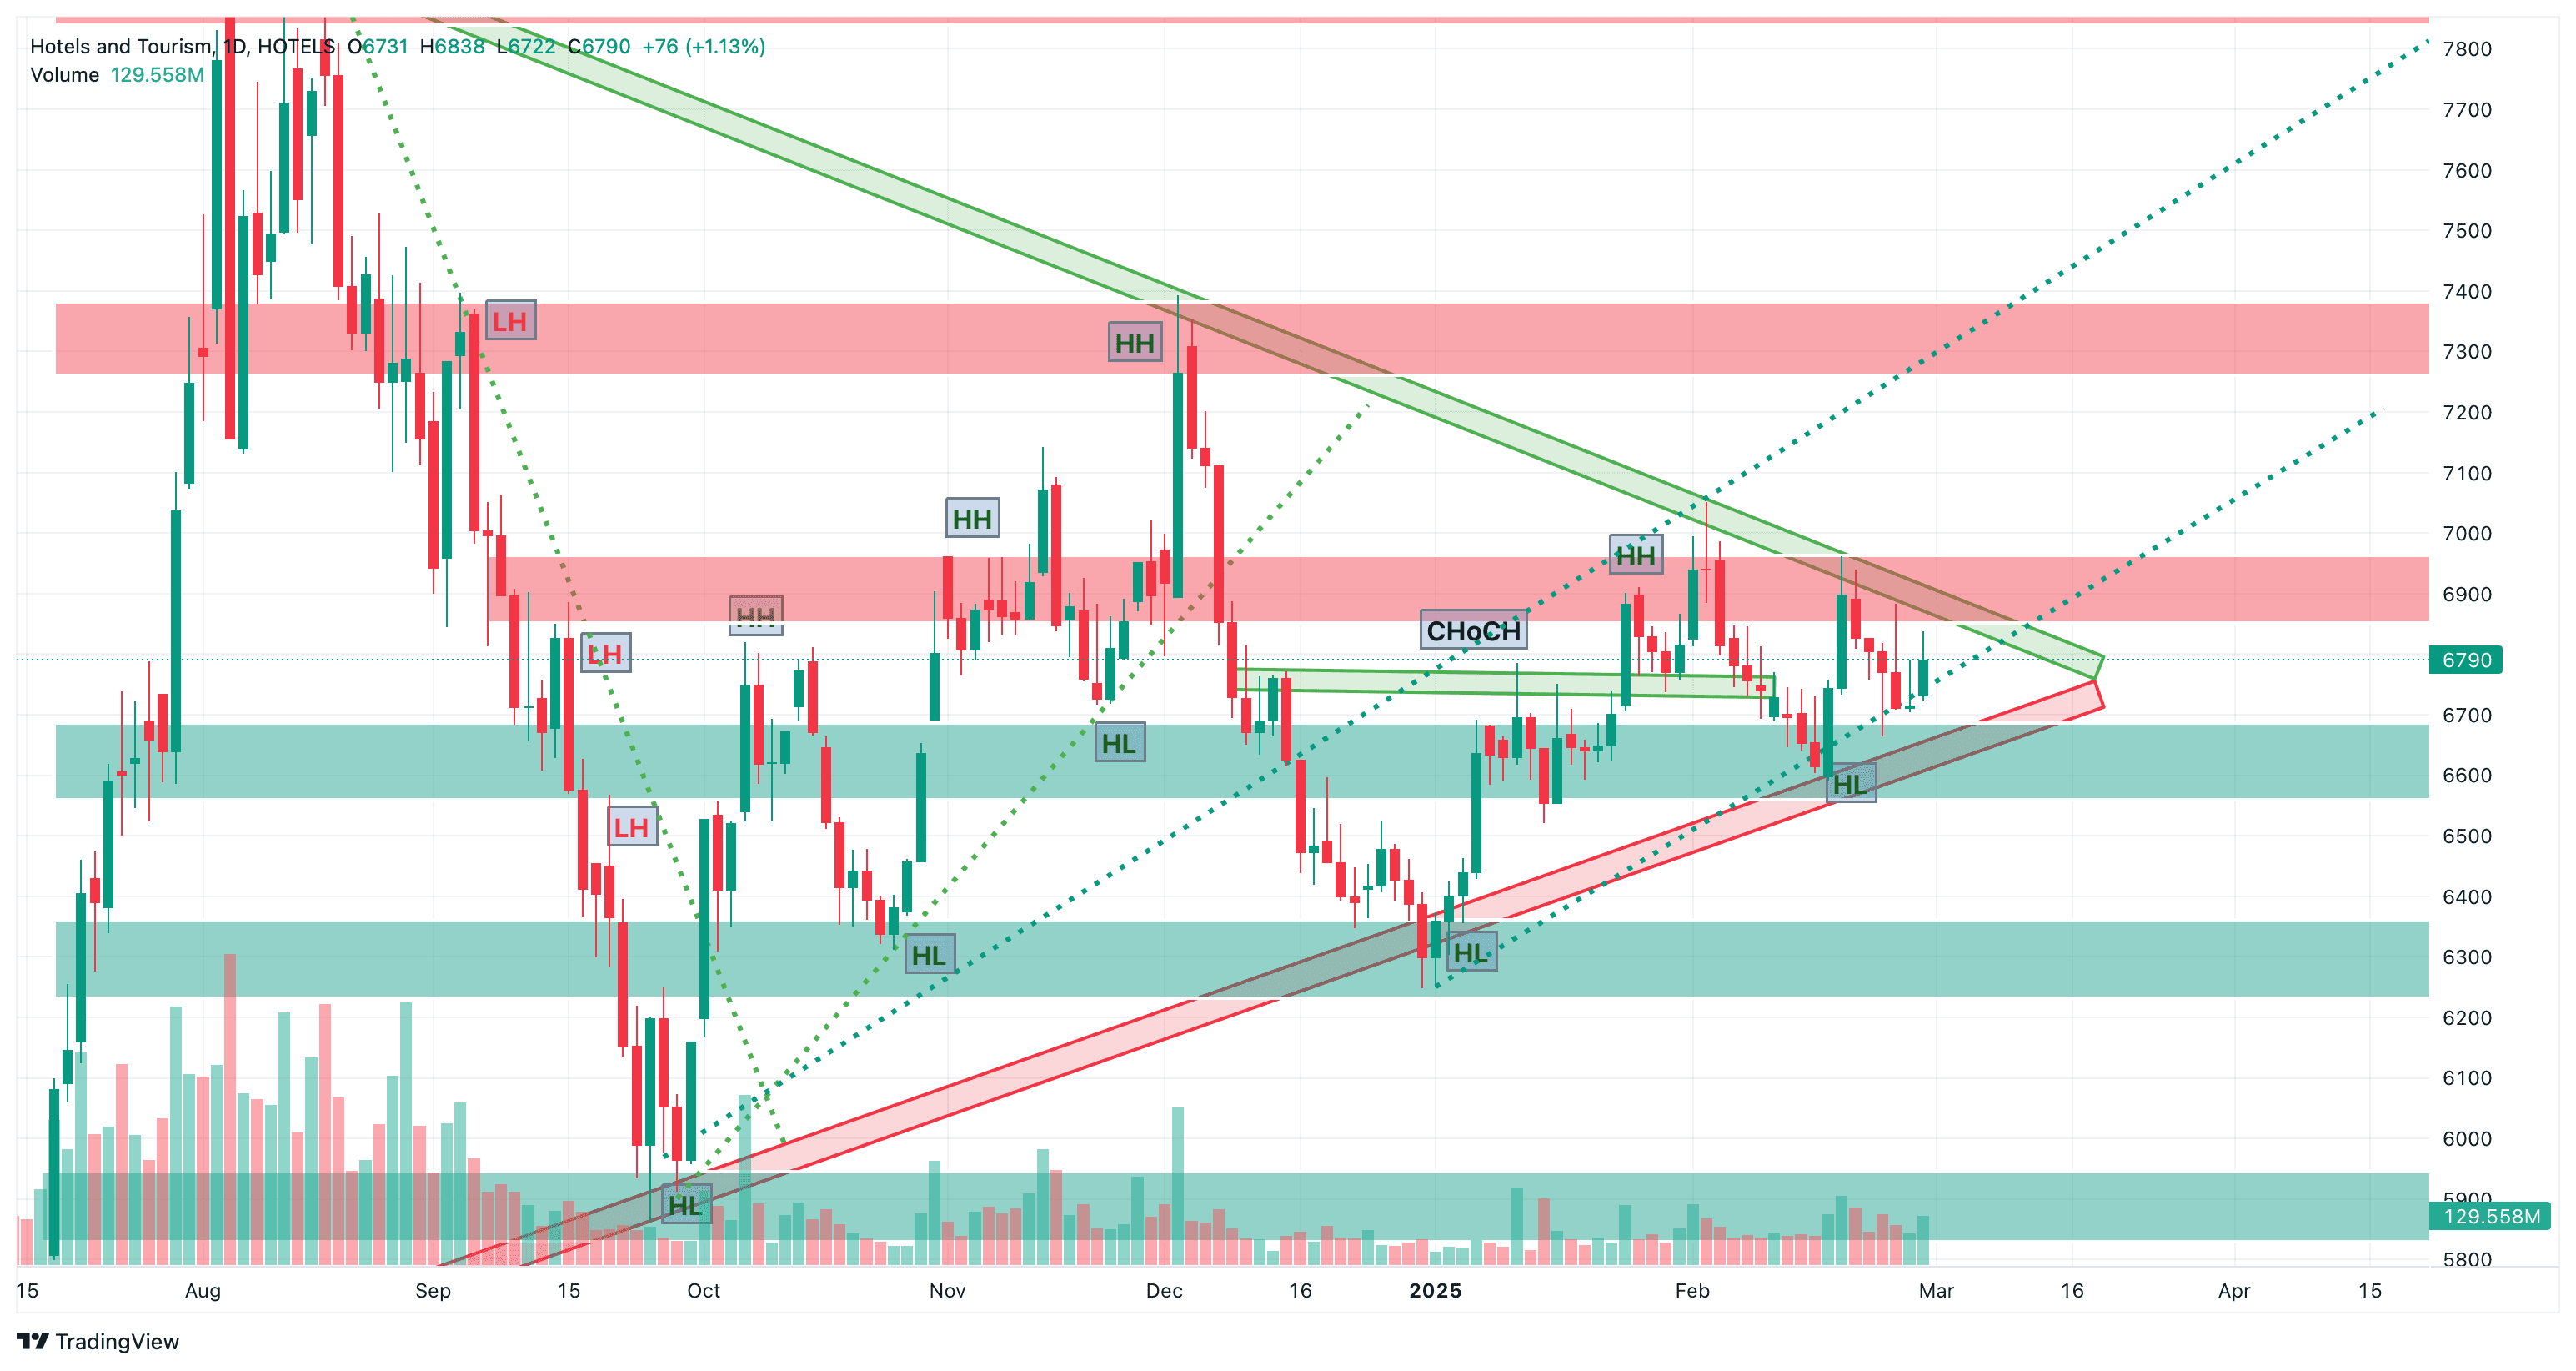
HOTELS_D चार्टको विस्तृत विश्लेषणले यो इन्डेक्समा एक आकर्षक सेटअप देखाउँछ। अगस्ट २०२४ देखि अप्रिल २०२५ सम्मको चार्टले डिसेन्डिङ वेज प्याटर्न देखाउँछ—जुन एक क्लासिक बुलिश रिभर्सल प्याटर्न हो। यो इन्डेक्सले लोअर हाइ (HH) र हायर लो (HL) बनाइरहेको छ, जसले यो वेजभित्र एक कन्सोलिडेसन चरणलाई संकेत गर्छ। यो प्याटर्नले प्रायः खरिद दबाबको निर्माणलाई संकेत गर्छ, जसले प्रायः माथिल्लो दिशामा ब्रेकआउटको संकेत दिन्छ।

हाल, यो इन्डेक्स ६७९० को स्तरमा हायर लो (HL) मा अवस्थित छ, जुन एक महत्वपूर्ण समर्थन क्षेत्र हो र विगतमा माथिल्लो चालको लागि आधारको रूपमा काम गरेको छ। यो HL पोजिसन डिसेन्डिङ वेजको तल्लो सीमासँग मेल खान्छ, जुन मध्य-२०२४ देखि इन्डेक्सलाई समर्थन दिइरहेको लामो समयको एसेंडिङ ट्रेन्ड लाइन (हरियो रंगमा देखिएको) सँग पनि मिल्छ। यी दुई ट्रेन्ड लाइनहरूको यो बिन्दुमा एकीकरणले ब्रेकआउटको सम्भावनालाई बढाउँछ, किनकि मूल्य एक साँघुरो दायरामा संकुचित भइरहेको छ, जुन प्रायः ठूलो चालको अग्रदूत हुन्छ।

प्रतिरोध र ब्रेकआउट सम्भावना

डिसेन्डिङ वेजको माथिल्लो सीमा, जुन रातो ट्रेन्ड लाइनले चिन्हित गरिएको छ, ६९००–७००० को दायरामा छ, जुन एक प्रमुख प्रतिरोध क्षेत्र हो जहाँ पहिले हायर हाइ (HH) बनेका थिए। यो स्तरभन्दा माथि निर्णायक ब्रेक, विशेष गरी बलियो भोल्युमसहित, ब्रेकआउटको पुष्टि गर्नेछ र इन्डेक्सलाई अर्को प्रमुख प्रतिरोध ७४००–७५०० तर्फ, जुन चार्टमा रातो छायाँ क्षेत्रले संकेत गरेको छ, लैजान सक्छ। यो सम्भावित चालले हालको स्तरबाट लगभग ९–१०% को माथिल्लो वृद्धिलाई प्रतिनिधित्व गर्छ, जसले HOTELS_D लाई जोखिम लिन इच्छुक लगानीकर्ताहरूको लागि आकर्षक खरिद बनाउँछ।

भोल्युम विश्लेषणले यो बुलिश दृष्टिकोणलाई थप समर्थन गर्छ। चार्टले १२९.५५८ मिलियनको भोल्युम देखाउँछ, जुन शिखर स्तरमा नभए पनि, इन्डेक्समा निरन्तर रुचि देखाउँछ। ब्रेकआउटमा भोल्युममा वृद्धि भएमा चालको बलको थप पुष्टि हुन्छ।

समर्थन र जोखिम व्यवस्थापन

तलतिर, इन्डेक्समा ६६०० र ६७०० बीचको बलियो समर्थन छ, जुन चार्टमा सियान छायाँ क्षेत्रले संकेत गरेको छ। यो क्षेत्रले पहिलेको पुनरावलोकनको समयमा भरपर्दो आधारको रूपमा काम गरेको छ, जसले जोखिम व्यवस्थापनको लागि यसको महत्वलाई पुनः पुष्टि गर्छ। HOTELS_D मा स्थिति विचार गरिरहेका लगानीकर्ताहरूले यो समर्थनलाई नजिकबाट निगरानी गर्नुपर्छ, किनकि यसको तलतिर ब्रेकले बुलिश सेटअपलाई अमान्य गर्न सक्छ र गहिरो सुधारको संकेत दिन सक्छ।

किन होटल्स एन्ड टुरिजम इन्डेक्स अग्रणी छ?

होटल्स एन्ड टुरिजम क्षेत्रले हालैका वर्षहरूमा जटिल परिदृश्यको सामना गरेको छ, जसमा मुद्रास्फीति, भू-राजनीतिक तनाव, र उपभोक्ता खर्चमा उतारचढाव जस्ता चुनौतीहरू समावेश छन्। तर, यो क्षेत्रले लचिलोपनको संकेत देखाइरहेको छ, जुन विश्वव्यापी यात्रा मागमा पुनरुत्थान, व्यापारिक यात्राको वृद्धि, र युवा जनसंख्यामा अनुभवात्मक खर्चको बढ्दो प्राथमिकताले संचालित छ। यी आधारभूत अनुकूलताहरू HOTELS_D चार्टमा देखिएको प्राविधिक बलसँग मिल्छ, जसले यसलाई एक आकर्षक लगानी अवसर बनाउँछ।

निष्कर्ष: रणनीतिक खरिद अवसर

होटल्स एन्ड टुरिजम इन्डेक्स (HOTELS_D) हाल किन्नको लागि उत्कृष्ट इन्डेक्सहरू मध्ये एक हो, विशेष गरी डिसेन्डिङ वेज प्याटर्नभित्रको HL पोजिसनमा। प्रमुख ट्रेन्ड लाइनभन्दा माथि ब्रेकआउटको सम्भावना, बलियो समर्थन स्तरहरू, र अनुकूल क्षेत्रीय गतिशीलताले यो इन्डेक्सलाई आगामी हप्ताहरूमा उल्लेखनीय वृद्धिको लागि तयार बनाउँछ। लगानीकर्ताहरूलाई ७००० भन्दा माथिको पुष्टि भएको ब्रेकआउटमा, बढेको भोल्युमसहित, प्रवेशको संकेतको रूपमा हेर्न सुझाव दिइन्छ, साथै जोखिम व्यवस्थापनको लागि ६६००–६७०० समर्थन क्षेत्रमा नजर राख्नुपर्छ।

सधैंझैं, लगानीकर्ताहरूले लगानी निर्णय गर्नुअघि आफ्नै अनुसन्धान गर्नुपर्छ र बजार अवस्थालाई विचार गर्नुपर्छ। तथापि, स्पष्ट प्राविधिक सेटअपसहित उच्च-सम्भावना ट्रेड खोज्नेहरूका लागि, HOTELS_D आजको बजारमा एक अग्रणी विकल्प हो।

The Hotels & Tourism Index (HOTELS_D) has emerged as a standout performer in the financial markets, capturing the attention of investors with its promising technical setup. As of the latest trading session, the index closed at 6790, marking a notable 1.13% decline, yet its current positioning suggests a potential breakout from a major trend line, making it a top pick for investors seeking growth opportunities.

Technical Analysis: A Bullish Setup in the Making

A detailed analysis of the HOTELS_D chart reveals a compelling setup for the index. The chart, spanning from August 2024 to April 2025, highlights a descending wedge pattern—a classic bullish reversal pattern. The index has been forming lower highs (HH) and higher lows (HL), indicating a consolidation phase within this wedge. This pattern typically signals a buildup of buying pressure, often preceding a breakout to the upside.

Currently, the index is positioned at a higher low (HL) around the 6790 level, a critical support zone that has historically acted as a springboard for upward moves. This HL position aligns with the lower boundary of the descending wedge, which coincides with a long-term ascending trend line (visible in green) that has supported the index since mid-2024. The convergence of these two trend lines at this juncture increases the likelihood of a breakout, as the price is being squeezed into a tighter range, often a precursor to a significant move.

Resistance and Breakout Potential

The upper boundary of the descending wedge, marked by the red trend line, sits near the 6900–7000 range, a key resistance zone where previous higher highs (HH) were formed. A decisive break above this level, particularly with strong volume, would confirm the breakout and could propel the index toward the next major resistance at 7400–7500, as indicated by the red shaded area on the chart. This potential move represents an upside of approximately 9–10% from current levels, making HOTELS_D an attractive buy for risk-tolerant investors.

Volume analysis further supports this bullish outlook. The chart shows a volume of 129.558M, which, while not at peak levels, is sufficient to suggest sustained interest in the index. A spike in volume on a breakout would provide additional confirmation of the move's strength.

Support and Risk Management

On the downside, the index has strong support between 6600 and 6700, as indicated by the cyan shaded area. This zone has acted as a reliable floor during previous pullbacks, reinforcing its importance as a key level for risk management. Investors considering a position in HOTELS_D should monitor this support closely, as a break below could invalidate the bullish setup and signal a deeper correction.

Why Hotels & Tourism Index Stands Out

The Hotels & Tourism sector has been navigating a complex landscape in recent years, with challenges such as inflation, geopolitical tensions, and fluctuating consumer spending. However, the sector is showing signs of resilience, driven by a resurgence in global travel demand, increased business travel, and a growing preference for experiential spending among younger demographics. These fundamental tailwinds align with the technical strength observed in the HOTELS_D chart, making it a compelling investment opportunity.

Conclusion: A Strategic Buying Opportunity

The Hotels & Tourism Index (HOTELS_D) is currently one of the best indices to buy, particularly in its HL position within a descending wedge pattern. The potential for a breakout above the major trend line, combined with strong support levels and favorable sector dynamics, positions the index for significant upside in the coming weeks. Investors are advised to watch for a confirmed breakout above 7000 with increased volume as a signal to enter, while keeping an eye on the 6600–6700 support zone for risk management.

As always, investors should conduct their own research and consider market conditions before making investment decisions. However, for those seeking a high-probability trade with a clear technical setup, HOTELS_D is a standout choice in today’s market.

Trending News

  • Trending2 Jul, 2026

    नेप्सेको आजको चार्टले के भन्छ : सन्तुलनको धरातलमा उभिएको बजारNEPSE Forms Hammer at Weak Low: Technical Signals Hint at Possible Turnaround, But Confirmation Still Pending

    Read news
  • Trending2 Jul, 2026

    चीनको बेइजिङमा नेपाल लगानी सम्मेलन, २०० भन्दा बढी लगानीकर्ता सहभागी हुनेNepal Investment Conference Begins in Beijing, Over 200 Investors Expected

    Read news
  • Trending2 Jul, 2026

    सरकारको १०० दिनमा आर्थिक सुधारको सकारात्मक संकेत देखिएको दाबीGovernment Claims Early Economic Gains Amid Reform Drive

    Read news

Related News

  • NEPSE Forms Hammer at Weak Low: Technical Signals Hint at Possible Turnaround, But Confirmation Still Pending
    Investor

    3 min read

    नेप्सेको आजको चार्टले के भन्छ : सन्तुलनको धरातलमा उभिएको बजारNEPSE Forms Hammer at Weak Low: Technical Signals Hint at Possible Turnaround, But Confirmation Still Pending

    NEPSE TRADING

    ·

    2 Jul, 2026

  • Nepal Investment Conference Begins in Beijing, Over 200 Investors Expected
    Top

    1 min read

    चीनको बेइजिङमा नेपाल लगानी सम्मेलन, २०० भन्दा बढी लगानीकर्ता सहभागी हुनेNepal Investment Conference Begins in Beijing, Over 200 Investors Expected

    NEPSE TRADING

    ·

    2 Jul, 2026

  • Government Claims Early Economic Gains Amid Reform Drive
    Top

    2 min read

    सरकारको १०० दिनमा आर्थिक सुधारको सकारात्मक संकेत देखिएको दाबीGovernment Claims Early Economic Gains Amid Reform Drive

    NEPSE TRADING

    ·

    2 Jul, 2026

  • Draft Company Law Amendment Proposes Stronger Investment Protection for Infrastructure Projects
    Investor

    1 min read

    कम्पनी ऐन संशोधन मस्यौदामा पूर्वाधार लगानीकर्तालाई नयाँ सुरक्षाDraft Company Law Amendment Proposes Stronger Investment Protection for Infrastructure Projects

    NEPSE TRADING

    ·

    2 Jul, 2026

  • Foreign Exchange Rates: Dollar Selling Rate at Rs 151.76, Kuwaiti Dinar the Most Expensive
    Investor

    1 min read

    विदेशी मुद्रा विनिमय दर : डलरको बिक्री मूल्य १५१.७६ रुपैयाँ, कुवेती दिनार सबैभन्दा महँगोForeign Exchange Rates: Dollar Selling Rate at Rs 151.76, Kuwaiti Dinar the Most Expensive

    Dipesh Ghimire

    ·

    1 Jul, 2026