NEPSEtrading

Make smarter moves backed by machine learning. Join thousands of traders leveraging AI to maximize profits.

nepsetrading.com is an online news portal that provides insights into trading and investment by analyzing the stock market and the global economy. We create charts based on the analysis of various indicators. Please do not rely solely on this information for investment decisions. Self-study is crucial. Use this information only as an educational and informational resource.

Marketminds Investment Group Private Limited

DOIB Registration certificate no.: 4680-2081/2082

Director & Editor-in-chief: Dipesh Ghimire · 9802363868, 9851119988

Koteshwor 32, Kathmandu
01-5253221 · +977 9709066745

Contact support

Subscribe to our newsletter

Weekly insights from the NEPSE market in your inbox.

Market

  • Stocks
  • Sectors

Company

  • About Us
  • Our Team
  • Terms of Use
  • Our Policy
  • Training
  • Contact Us

Help

  • Support
  • Report
  • FAQ

© 2026 nepsetrading.com. All rights reserved.
Owned and operated by Marketminds Investment Group Private Limited.

Charts powered by TradingView

  • Home
  • Latest
  • Trending
  • Stock
  • Education
  • International
    1. News
    2. Investor
    3. Index Falls for Second Straight Session, Investors Remain in “Wait and Watch” Mode
    कारोबार रकम सुक्दै, प्राविधिक चार्टले पनि देखायो कमजोरी, तर मुख्य सपोर्ट अझै सुरक्षित
    Investor
    4 min read
    Updated on May 13, 2026
    NEPSE TRADING

    कारोबार रकम सुक्दै, प्राविधिक चार्टले पनि देखायो कमजोरी, तर मुख्य सपोर्ट अझै सुरक्षितIndex Falls for Second Straight Session, Investors Remain in “Wait and Watch” Mode

    नेपाली शेयर बजार बुधबार पनि दबाबमै बन्द भएको छ । लगातार दोस्रो कारोबार दिन नेप्से परिसूचक घटेर बन्द हुँदा बजारमा देखिएको अन्योलता अझै गहिरिएको विश्लेषण गरिएको छ । पछिल्ला केही सातायता बजारले स्पष्ट दिशा समात्न नसकिरहेको अवस्थामा कारोबार रकम निरन्तर घट्नु, लगानीकर्ताको मनोबल कमजोर देखिनु तथा सीमित कम्पनीमा मात्रै कारोबार केन्द्रित हुनुले बजार अझै ‘कन्फ्युजन फेज’ मा रहेको संकेत गरेको हो ।

    नेपाल स्टक एक्सचेञ्ज (नेप्से) परिसूचक बुधबार ४.१५ अंकले घटेर २७४०.२५ विन्दुमा बन्द भयो । अंकका आधारमा गिरावट ठूलो नदेखिए पनि कारोबार रकममा आएको तीव्र कमीले बजारको वास्तविक अवस्था झनै कमजोर देखाएको विश्लेषकहरू बताउँछन् । अघिल्लो कारोबार दिन ४ अर्ब ६६ करोड रुपैयाँभन्दा बढीको कारोबार भएको बजारमा बुधबार कारोबार रकम घटेर २ अर्ब ८० करोड रुपैयाँमा सीमित भयो ।

    यसदिन ३३९ कम्पनीको ५६ लाख ४३ हजार कित्ता शेयर किनबेच हुँदा कुल ४२ हजारभन्दा बढी कारोबार भएका थिए । बजारमा सामान्य उतारचढाव देखिए पनि अन्तिम समयमा सूचकले उल्लेख्य सुधार गर्न नसक्दा लगानीकर्ता अझै विश्वस्त हुन नसकेको देखिएको छ ।

    विश्लेषकहरूका अनुसार बजार अहिले स्पष्ट ट्रेन्डविहीन अवस्थामा पुगेको छ । केही समयअघि बजारमा देखिएको तीव्र उत्साह विस्तारै सेलाउँदै गएको छ भने छोटो अवधिमा नाफा कमाएका लगानीकर्ताले ‘प्रोफिट बुकिङ’ सुरु गरेका छन् । त्यसको प्रभाव कारोबार रकममा प्रत्यक्ष देखिन थालेको छ । बजारमा नयाँ पैसा प्रवेश गर्ने गति सुस्त हुँदा केही सीमित समूहले मात्र निश्चित कम्पनीमा कारोबार गरिरहेको अवस्था देखिएको छ ।

    बजार समग्र रूपमा कमजोर देखिए पनि केही कम्पनीमा भने उल्लेख्य वृद्धि देखियो । एशियन हाइड्रोपावरको शेयरमूल्य सर्वाधिक ११.४२ प्रतिशतले बढ्यो । त्यस्तै एसवाई प्यानल नेपालको शेयरमूल्य पनि साढे ४ प्रतिशतभन्दा बढीले उकालो लाग्यो । तर अधिकांश कम्पनीमा भने सामान्य गिरावट देखिएको थियो । खरिदकर्ता कमजोर बन्दै जाँदा साना तथा मध्यम समूहका धेरै कम्पनी दबाबमा परेको विश्लेषण गरिएको छ ।

    अर्कोतर्फ धौलागिरी लघुवित्त वित्तीय संस्थाको शेयरमूल्य सर्वाधिक ११.१७ प्रतिशतले घट्यो । झापा इनर्जीको शेयरमूल्य पनि करिब साढे ९ प्रतिशतले ओरालो लाग्यो । पछिल्लो समय तीव्र रूपमा बढेका केही कम्पनीमा लगानीकर्ताले नाफा सुरक्षित गर्न थालेपछि ती कम्पनीमा उच्च गिरावट देखिएको बजार विश्लेषकहरूको भनाइ छ ।

    कारोबार रकमका आधारमा भने एसवाई प्यानल नेपाल अग्रस्थानमा रह्यो । कम्पनीको २७ करोड ७९ लाख रुपैयाँभन्दा बढीको शेयर कारोबार भएको थियो । त्यस्तै रिडी पावर कम्पनी र साहस उर्जामा पनि उल्लेख्य कारोबार देखिएको छ । बजार समग्र रूपमा कमजोर भए पनि केही ‘स्टक स्पेसिफिक’ गतिविधि अझै सक्रिय रहेको यसले देखाएको विश्लेषण गरिएको छ ।

    उपसमूहतर्फ हेर्दा १३ मध्ये ११ उपसमूह राताम्मे भए । व्यापार उपसमूह भने सर्वाधिक १.५० प्रतिशतले बढ्यो भने उत्पादन तथा प्रशोधन समूह सामान्य हरियो रह्यो । बैंकिङ, विकास बैंक, जलविद्युत, बीमा, लघुवित्तलगायत अधिकांश समूह दबाबमा देखिएका छन् । यसले बजारमा व्यापक खरिदभन्दा पनि सीमित क्षेत्रीय गतिविधि मात्रै सक्रिय रहेको संकेत गरेको छ ।

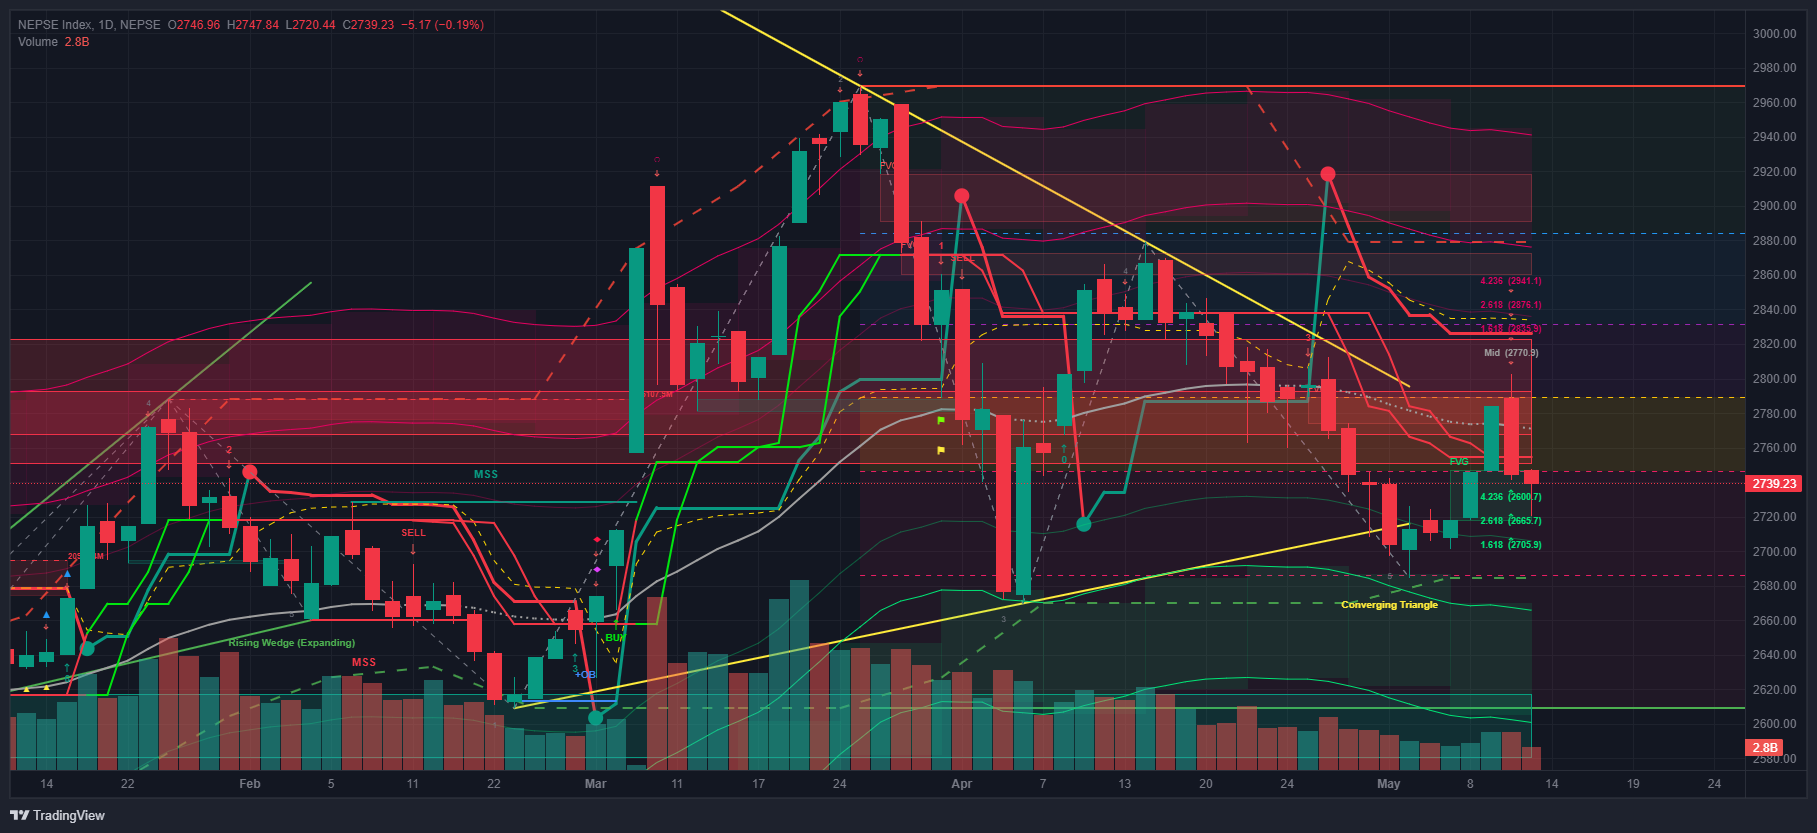
    अब लागौं प्राविधिक विश्लेषणतर्फ। बुधबार बनेको डे चार्टले पनि बजारमा तत्काल बलियो सुधारको संकेत दिएको छैन । लगातार दोस्रो दिन दबाबमा बन्द भएको बजारले लगानीकर्तालाई स्पष्ट दिशा दिन सकेन । कारोबार रकम तीव्र रूपमा घटेको अवस्थामा नेप्से परिसूचक २७३९ विन्दु आसपास बन्द हुँदा बजार अझै ‘वेट एन्ड वाच’ अवस्थामै रहेको प्राविधिक विश्लेषकहरूको भनाइ छ ।

    आज बनेको डे क्याण्डललाई प्राविधिक रूपमा हेर्दा यो “बेयरिस स्मल बडी क्याण्डल” को रूपमा देखिएको छ । दिनको सुरुवातमा बजार माथि जाने प्रयासमा देखिए पनि माथिल्लो क्षेत्रमा बिक्री दबाब हाबी भएपछि सूचक फेरि तल झरेको देखिन्छ । क्याण्डलको माथिल्लो भागमा बनेको विकले माथिल्लो क्षेत्रमा अझै पनि सप्लाई बलियो रहेको संकेत गरेको छ । यद्यपि तल्लो भागमा ठूलो विक नबन्नुले तत्काल ठूलो प्यानिक सेलिङ भने नरहेको बुझिन्छ ।

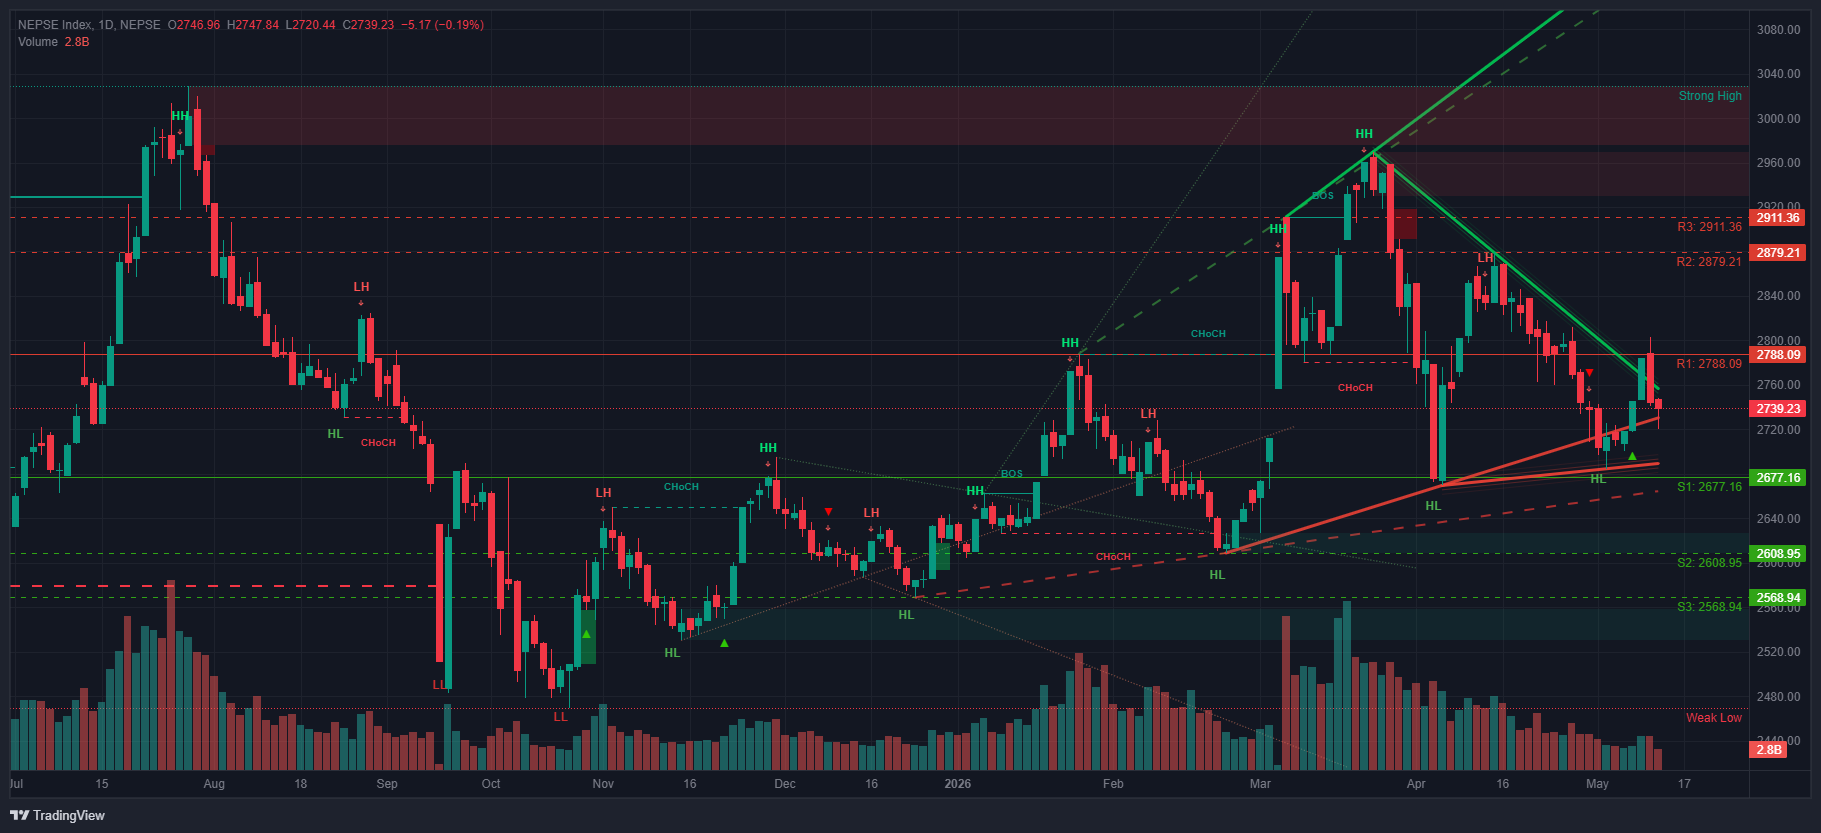
    चार्टमा देखिएको संरचनाअनुसार बजार अहिले पनि “लोअर हाई” बनाउने क्रममा देखिएको छ । यसअघि बनेको उच्च विन्दु नजिक पुग्न नसक्दै बजार फेरि कमजोर बनेको छ । विशेषगरी २८७९ देखि २९११ को क्षेत्रलाई चार्टमा बलियो रेजिस्टेन्सको रूपमा देखाइएको छ । बजारले पछिल्ला प्रयासहरूमा यो क्षेत्र तोड्न नसक्दा छोटो अवधिको ट्रेन्ड अझै दबाबमै रहेको संकेत मिलेको छ ।

    यद्यपि सकारात्मक पक्ष पूर्ण रूपमा समाप्त भइसकेको अवस्था भने छैन । चार्टमा देखिएको मुख्य ट्रेन्डलाइन अझै पूर्ण रूपमा ब्रेक भएको छैन । बजार अहिले २६७७ विन्दु आसपासको सपोर्ट जोनभन्दा माथि टिकिरहेको छ, जुन छोटो अवधिका लागि महत्वपूर्ण आधार क्षेत्र मानिएको छ । यदि बजारले यो क्षेत्र जोगाउन सफल भयो भने फेरि माथिल्लो उछालको सम्भावना कायम रहन सक्ने विश्लेषण गरिएको छ ।

    चार्टमा प्रयोग गरिएको “एचएच, एचएल र एलएच” संरचनाले बजारमा अहिले स्पष्ट दिशाहीनता देखाएको छ । केही समयअघि बजारले “हायर हाई” र “हायर लो” बनाउँदै सुधारको संकेत दिएको थियो । तर पछिल्लो चरणमा फेरि “लोअर हाई” बन्न थालेपछि खरिदकर्ता कमजोर हुँदै गएको बुझिन्छ । यसले बजारमा ठूलो पैसा अझै पूर्ण रूपमा प्रवेश नगरेको संकेत पनि दिएको छ ।

    त्यस्तै चार्टमा देखिएको “चोच” अर्थात् “चेंज अफ क्यारेक्टर” संकेतले बजारको गति पटक–पटक परिवर्तन भइरहेको देखाएको छ । केही समयअघि बनेको बुलिस संरचना अहिले कमजोर बन्दै गएको छ । विशेषगरी कारोबार रकम लगातार घट्नुले बजारमा विश्वास कमजोर भएको पुष्टि गरेको विश्लेषण गरिएको छ ।

    भोलिका कारोबारका लागि २६७७ विन्दु निकै महत्वपूर्ण देखिएको छ । यदि बजार यो क्षेत्रभन्दा तल झर्‍यो भने २६०८ र त्यसपछि २५६८ विन्दुसम्म दबाब बढ्न सक्ने सम्भावना देखिन्छ । अर्कोतर्फ बजारले पुनः सुधारका लागि २७८८ विन्दुभन्दा माथि बलियो क्लोजिङ दिनुपर्ने देखिन्छ । त्योभन्दा माथि गए मात्रै २८७९ र २९११ को रेजिस्टेन्स क्षेत्रमा पुनः परीक्षण हुने सम्भावना रहने विश्लेषण गरिएको छ ।

    समग्रमा हेर्दा आजको बजार र प्राविधिक चार्ट दुवैले एउटै संकेत गरेका छन्—बजार तत्काल ठूलो दुर्घटनातर्फ गएको होइन, तर कमजोर हुँदै स्थिर रहने चरणमा पुगेको छ । कारोबार रकम घट्नु, माथिल्लो क्षेत्रमा बिक्री दबाब बढ्नु र सूचकले लगातार लोअर हाई बनाउनु छोटो अवधिका लागि सावधानीको संकेत भए पनि मुख्य सपोर्ट अझै सुरक्षित रहेकाले बजार पूर्ण रूपमा नकारात्मक भइसकेको निष्कर्ष निकाल्न भने हतार हुने अवस्था नरहेको विश्लेषकहरू बताउँछन् ।

    The Nepali stock market closed lower again on Wednesday, extending its losing streak for a second consecutive trading session. Although the decline in the benchmark index remained modest, the sharp fall in turnover and the lack of broad buying interest reflected growing uncertainty among investors. Over the past few weeks, the market has struggled to establish a clear direction, with many investors adopting a cautious “wait and watch” strategy amid mixed signals from both fundamentals and technical indicators.

    The Nepal Stock Exchange (NEPSE) index declined by 4.15 points to close at 2740.25 points on Wednesday. While the numerical fall in the index was not significant, analysts say the steep drop in trading volume painted a much weaker picture underneath the surface. Daily turnover dropped sharply to around NPR 2.80 billion, compared to more than NPR 4.66 billion recorded in the previous trading session.

    A total of 339 companies traded during the session, with more than 5.64 million shares changing hands through over 42,000 transactions. Despite intraday fluctuations, the market failed to recover meaningfully toward the closing hours, suggesting that investor confidence has yet to return fully.

    According to market analysts, the current market structure remains trendless and indecisive. The strong optimism seen earlier in the rally appears to be fading gradually, while short-term traders have increasingly started booking profits. That behavior is now becoming visible in the declining turnover figures as well. Analysts also note that the inflow of fresh money into the market has slowed, causing trading activity to remain concentrated in only a handful of stocks.

    Even in a broadly weak market, a few companies posted notable gains. Asian Hydropower emerged as the top gainer, with its share price rising by 11.42 percent. Similarly, SY Panel Nepal gained more than 4.5 percent during the session. However, most stocks closed lower, reflecting weakening buying momentum across the broader market. Analysts believe pressure has particularly increased in small- and mid-cap stocks as buyers become more selective.

    On the losing side, Dhaulagiri Laghubitta Financial Institution recorded the steepest decline, falling 11.17 percent. Jhapa Energy also dropped by nearly 9.5 percent. Market observers say that many stocks which rallied aggressively in recent weeks are now facing heavy profit-booking pressure, leading to sharper corrections.

    In terms of turnover, SY Panel Nepal led the market with transactions worth over NPR 277.9 million. Ridi Power Company and Sahas Urja also witnessed notable trading activity. Although the broader market remained weak, concentrated trading in a few counters suggested that stock-specific movements are still active beneath the overall sluggish market environment.

    Sector-wise, 11 out of the 13 sub-indices closed in the red. The Trading sector was the only major outperformer, gaining 1.50 percent, while the Manufacturing and Processing sector posted a marginal rise. Banking, development banks, hydropower, insurance, microfinance and several other sectors remained under pressure. Analysts say this reflects a market driven more by selective activity rather than broad-based institutional buying.

    Now turning to the technical analysis, Wednesday’s daily chart also failed to provide a strong bullish signal. The market closed under pressure for the second consecutive day, while rapidly declining turnover continued to reinforce the cautious sentiment among traders. Technical analysts say the market remains firmly in a “wait and watch” phase as investors hesitate to take aggressive positions.

    From a candlestick perspective, Wednesday’s formation appeared to be a “bearish small-body candle,” often interpreted as a sign of weakness or indecision. Although the market initially attempted to move higher during the session, selling pressure emerged at upper levels and dragged the index back down. The upper wick on the candle indicates that supply remains strong near resistance zones. However, the absence of a large lower wick also suggests that panic selling has not yet entered the market.

    The broader chart structure still shows the market forming a “Lower High” pattern. The index failed to revisit its previous peak and once again lost momentum before reaching higher resistance levels. Analysts identify the 2879 to 2911 zone as a major resistance area. Since the market has repeatedly failed to break above that range, the short-term trend continues to remain under pressure.

    Despite the recent weakness, analysts say the positive side has not completely disappeared. The primary upward trendline shown on the chart has not yet been decisively broken. The market is still trading above the important support zone near 2677 points, which is being viewed as a critical short-term base. If the index manages to defend this level, the possibility of another upward rebound may still remain alive.

    The HH (Higher High), HL (Higher Low), and LH (Lower High) structures visible on the chart further indicate the market’s current indecisive nature. Earlier, the market had been forming higher highs and higher lows, signaling a bullish recovery trend. However, the recent emergence of lower highs suggests that buyers are gradually losing strength. Analysts believe this also indicates that large institutional money has not yet fully returned to the market.

    Another important indicator on the chart is the “CHoCH” or “Change of Character” signal, which reflects repeated shifts in market momentum. The earlier bullish structure now appears to be weakening gradually. Falling turnover alongside repeated reversals has strengthened the argument that market confidence remains fragile.

    For the coming sessions, analysts view 2677 points as the most critical support level. If the market falls below this zone, selling pressure could intensify toward 2608 points and potentially even 2568 points. On the upside, the index needs a strong close above 2788 points to regain bullish momentum. Only then could the market attempt another test of the 2879–2911 resistance region.

    Overall, both the market behavior and the technical chart suggest that the market is not yet entering a major collapse, but rather moving through a phase of weakening consolidation. Shrinking turnover, repeated selling pressure near upper levels, and the formation of lower highs indicate caution in the short term. However, as long as the major support zones remain intact, analysts believe it may still be premature to conclude that the broader market trend has fully turned negative.

    Trending News

    • Trending14 Jun, 2026

      असारमा वाणिज्य बैंकको मुद्दति ब्याजदर थप घट्यो, ७ बैंकले दर घटाए

      Read news
    • Trending14 Jun, 2026

      नेपालकै सबैभन्दा ठूलो सम्पत्ति शुद्धीकरण मुद्दा अदालत पुग्यो, एक खर्ब ६ अर्बभन्दा बढी बिगो दाबी

      Read news
    • Trending14 Jun, 2026

      अमेरिका–इरान शान्ति सम्झौता निर्णायक मोडमा, पाकिस्तानले भन्यो — '२४ घण्टामा हस्ताक्षर सम्भव'

      Read news

    Related News

  • असारमा वाणिज्य बैंकको मुद्दति ब्याजदर थप घट्यो, ७ बैंकले दर घटाए
    Investor

    1 min read

    असारमा वाणिज्य बैंकको मुद्दति ब्याजदर थप घट्यो, ७ बैंकले दर घटाए

    NEPSE TRADING

    ·

    14 Jun, 2026

  • नेपालकै सबैभन्दा ठूलो सम्पत्ति शुद्धीकरण मुद्दा अदालत पुग्यो, एक खर्ब ६ अर्बभन्दा बढी बिगो दाबी
    Investor

    4 min read

    नेपालकै सबैभन्दा ठूलो सम्पत्ति शुद्धीकरण मुद्दा अदालत पुग्यो, एक खर्ब ६ अर्बभन्दा बढी बिगो दाबी

    NEPSE TRADING

    ·

    14 Jun, 2026

  • अमेरिका–इरान शान्ति सम्झौता निर्णायक मोडमा, पाकिस्तानले भन्यो — '२४ घण्टामा हस्ताक्षर सम्भव'
    Top

    1 min read

    अमेरिका–इरान शान्ति सम्झौता निर्णायक मोडमा, पाकिस्तानले भन्यो — '२४ घण्टामा हस्ताक्षर सम्भव'

    NEPSE TRADING

    ·

    14 Jun, 2026

  • शेयर बजारमा जलविद्युत कम्पनी : अनुत्तरित प्रश्नहरूको भारले थिचिएको लगानीकर्ता
    Investor

    5 min read

    शेयर बजारमा जलविद्युत कम्पनी : अनुत्तरित प्रश्नहरूको भारले थिचिएको लगानीकर्ता

    NEPSE TRADING

    ·

    12 Jun, 2026

  • नेपालको पुँजी बजार : तीन दशकको यात्रा, अझै अधुरो सुधार
    Investor

    3 min read

    नेपालको पुँजी बजार : तीन दशकको यात्रा, अझै अधुरो सुधार

    Dipesh Ghimire

    ·

    12 Jun, 2026