NEPSEtrading

Make smarter moves backed by machine learning. Join thousands of traders leveraging AI to maximize profits.

nepsetrading.com is an online news portal that provides insights into trading and investment by analyzing the stock market and the global economy. We create charts based on the analysis of various indicators. Please do not rely solely on this information for investment decisions. Self-study is crucial. Use this information only as an educational and informational resource.

Marketminds Investment Group Private Limited

DOIB Registration certificate no.: 4680-2081/2082

Director & Editor-in-chief: Dipesh Ghimire · 9802363868, 9851119988

Koteshwor 32, Kathmandu
01-5253221 · +977 9709066745

Contact support

Subscribe to our newsletter

Weekly insights from the NEPSE market in your inbox.

Get the app

Track markets, signals and alerts from your phone.

Get it onGoogle Play

Market

  • Stocks
  • Sectors

Company

  • About Us
  • Our Team
  • Terms of Use
  • Our Policy
  • Training
  • Contact Us

Help

  • Support
  • Report
  • FAQ

© 2026 nepsetrading.com. All rights reserved.
Owned and operated by Marketminds Investment Group Private Limited.

Charts powered by TradingView

  1. News
  2. Investor
  3. NEPSE Bull Market: Projections, Psychology, and Portfolio Perspective
नेप्से बुल बजार विश्लेषण : लक्ष्य कति? तर महत्व कहाँ?
Investor
2 min read
Published on July 10, 2025
Subas Chandra Dhungana

नेप्से बुल बजार विश्लेषण : लक्ष्य कति? तर महत्व कहाँ?NEPSE Bull Market: Projections, Psychology, and Portfolio Perspective

— शेयर बजारका विश्लेषण सुवासचन्द ढुंगानाले ऐतिहासिक तथ्यांक र फिबोनाच्ची आधारमा तयार गरिएको अनुमानसहितको समीक्षा

हालका दिनमा लगानीकर्ताहरूले बारम्बार सोध्ने प्रश्न हो:
"यदि बजार बुलमै छ भने यसको टार्गेट कति हो?"

यो प्रश्न सामान्य देखिए पनि, यसको पछाडि बजार मनोविज्ञान, पोर्टफोलियो रणनीति र प्राविधिक विश्लेषणको गहिरो पक्ष लुकेको छ।

बुलको टार्गेट किन खासै महत्त्वपूर्ण हुँदैन?

धेरै विश्लेषकहरू भन्छन् — बजारको सूचकांक (इन्डेक्स) कुन अंकसम्म पुग्छ भन्ने भन्दा पोर्टफोलियोमा बुल आएको छ कि छैन भन्ने बढी महत्त्वपूर्ण हुन्छ। केही ठूला कम्पनीहरू वा नव-सूचीकृत कम्पनीहरूमात्र चल्दा पनि बजार सूचकांक चुलिन सक्छ, तर साना लगानीकर्ताको पोर्टफोलियो निष्क्रियै हुन सक्छ।

त्यसैले, बुल बजारको टार्गेट भन्दा पनि तपाईंको पोर्टफोलियोले लाभ लिइरहेको छ कि छैन भन्ने कुरामा ध्यान दिनु वास्तविक रणनीति हो।

एउटा अनुमानको आधार : विगतका बुल मार्केटहरू

सूचकांकको लक्ष्यको अनुमान लगाउँदा, दुई प्रमुख आधार प्रयोग गरिएको छ:

१) बुलदेखि बुलसम्मको बृद्धि दर

बुलको आरम्भ र अन्त्यको बिचको अन्तर नहेरी, एउटा बुलको टुप्पोदेखि अर्को बुलको टुप्पोसम्मको बृद्धि हेरेको छ।

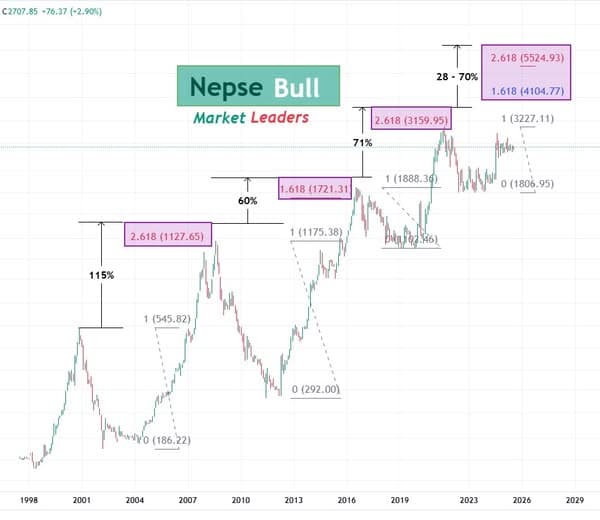
  • पहिलो बुलमा सूचकांक ११५% ले वृद्धि भएको थियो।

  • त्यसपछि भएका दुई बुलहरूले ६०–७०% सम्मको वृद्धि देखाएका थिए।

यस अनुसार अहिलेको बुलले कम्तीमा पनि ६०% को बृद्धि गर्ने अनुमान गर्न सकिन्छ।

२) फिबोनाच्ची रिट्रेसमेन्ट (Fibonacci Retracement)

यो प्राविधिक विधिमा विगतका तीनवटा बुल चल्हरूको विश्लेषण गरिएको छ, जसमा:

  • एउटा बुल 1.618 ले विस्तार भएको थियो,

  • बाँकी दुई बुलहरू 2.618 सम्म विस्तार भएका थिए।

यदि अहिलेको बुल पनि यस्तै गतिमा चल्यो भने:

  • 1.618 विस्तार अनुसार सूचकांक ४१०० अंक पुग्न सक्छ — जुन अघिल्लो टुप्पोभन्दा २८% माथि हो।

  • 2.618 विस्तार अनुसार सूचकांक ५५२५ अंक पुग्न सक्छ — जुन अघिल्लो टुप्पोभन्दा ७०% माथि हो।

तर याद राखौं — बजार सधैं पूर्वानुमानअनुसार चल्दैन

यी अनुमानहरू पूर्ण विश्वासयोग्य भविष्यवाणी होइनन्। बजारमा ब्याजदर, कर्जा प्रवाह, बजेट, बैंकको तरलता, र अन्तर्राष्ट्रिय परिदृश्य जस्ता विषयहरूले असर गर्छन्। त्यसैले अनुमानहरूलाई सन्दर्भको रूपमा लिने, रणनीतिक रूपमा पोर्टफोलियो तयार पार्ने नै सहि बाटो हो।

नेप्से बजार अहिले बुल चरणमा देखिएको छ। तर ४१०० होस् वा ५५२५ — सूचकांकको टार्गेट तपाईंको कमाइको ग्यारेन्टी होइन।
मुख्य कुरा — तपाईंको पोर्टफोलियोमा बुल आइरहेको छ कि छैन भन्ने बुझ्नु हो।

यदि छ भने — तपाईं साँचो अर्थमा बजारसँगै अघि बढ्दै हुनुहुन्छ।
यदि छैन भने — सूचकांकको संख्याले खासै फरक पार्दैन।

धन्यवाद 💚

— Market analysis based on historical patterns and Fibo-based estimates

In recent days, a frequently raised question among investors and analysts alike has been: “If the market is in a bull trend, what is the target of this bull run?” While seemingly simple, this question opens a broader conversation about the nature of bull markets, portfolio strategy, and the reliability of technical forecasting tools.

Why Bull Targets Might Not Matter Much

Market experts argue that pinpointing a specific index target during a bull run may be of limited significance. The reasoning is straightforward — in a market where only a few large-cap companies or newly listed influential stocks gain momentum, the index itself can move upward without widespread participation. In such cases, the overall index may rise while many investors feel left behind.

Hence, what truly matters is whether your individual portfolio is participating in the bull run, not necessarily whether the NEPSE index crosses a predefined numerical milestone. For those whose portfolio hasn't yet reflected the optimism in the market, there is often skepticism about the sustainability of the rally — an entirely psychological hurdle.

Technical Projections Based on Past Bull Runs

Despite the argument that index targets are secondary, historical data does provide useful frameworks to estimate potential market trajectories. Two such methods are being used for the current NEPSE rally:

1. Bull-to-Bull Growth Pattern

Instead of measuring from the bottom of a bear market to the top of the bull, this approach evaluates growth from one bull peak to the next. Historical data shows:

  • The first significant bull cycle recorded a 115% increase.

  • Subsequent bull cycles showed more conservative growth in the range of 60–70%.

This pattern suggests that even a moderate rally from the previous peak could still yield meaningful gains.

2. Fibonacci Retracement Extension

A more technical approach involves the Fibonacci Retracement tool, commonly used in technical analysis to identify potential support and resistance levels based on previous market swings.

  • In previous bull markets, NEPSE has extended up to the 1.618 and even 2.618 levels of the retracement tool.

If this current bull follows a similar Fibo-based path:

  • A 1.618 retracement level would place NEPSE at around 4100, representing a 28% increase from the last bull peak.

  • A 2.618 extension would target 5525, indicating a 70% surge from the last high.

Caution: Patterns Are Not Promises

While historical charts and Fibonacci projections are valuable tools, they do not guarantee future performance. Markets are influenced by external factors — monetary policy, liquidity, global trends, political events, and sectoral performance. The projections serve as reference points, not certainties.

What’s more crucial is how investors align their portfolios to take advantage of sectoral trends, risk appetite, and liquidity cycles, rather than solely chasing the index target.

The NEPSE market seems to be in a confirmed bullish phase, but index targets — whether 4100 or 5525 — should not distract investors from the core question: Is your portfolio positioned to ride the bull? Whether the broader market meets historical Fibonacci targets or not, those with informed strategies and diversified holdings are more likely to benefit.

As always, historical patterns can guide expectations, but market behavior remains inherently dynamic.

Thank you. 💚

Trending News

  • Trending2 Jul, 2026

    नेप्सेको आजको चार्टले के भन्छ : सन्तुलनको धरातलमा उभिएको बजारNEPSE Forms Hammer at Weak Low: Technical Signals Hint at Possible Turnaround, But Confirmation Still Pending

    Read news
  • Trending2 Jul, 2026

    चीनको बेइजिङमा नेपाल लगानी सम्मेलन, २०० भन्दा बढी लगानीकर्ता सहभागी हुनेNepal Investment Conference Begins in Beijing, Over 200 Investors Expected

    Read news
  • Trending2 Jul, 2026

    सरकारको १०० दिनमा आर्थिक सुधारको सकारात्मक संकेत देखिएको दाबीGovernment Claims Early Economic Gains Amid Reform Drive

    Read news

Related News

  • NEPSE Forms Hammer at Weak Low: Technical Signals Hint at Possible Turnaround, But Confirmation Still Pending
    Investor

    3 min read

    नेप्सेको आजको चार्टले के भन्छ : सन्तुलनको धरातलमा उभिएको बजारNEPSE Forms Hammer at Weak Low: Technical Signals Hint at Possible Turnaround, But Confirmation Still Pending

    NEPSE TRADING

    ·

    2 Jul, 2026

  • Nepal Investment Conference Begins in Beijing, Over 200 Investors Expected
    Top

    1 min read

    चीनको बेइजिङमा नेपाल लगानी सम्मेलन, २०० भन्दा बढी लगानीकर्ता सहभागी हुनेNepal Investment Conference Begins in Beijing, Over 200 Investors Expected

    NEPSE TRADING

    ·

    2 Jul, 2026

  • Government Claims Early Economic Gains Amid Reform Drive
    Top

    2 min read

    सरकारको १०० दिनमा आर्थिक सुधारको सकारात्मक संकेत देखिएको दाबीGovernment Claims Early Economic Gains Amid Reform Drive

    NEPSE TRADING

    ·

    2 Jul, 2026

  • Draft Company Law Amendment Proposes Stronger Investment Protection for Infrastructure Projects
    Investor

    1 min read

    कम्पनी ऐन संशोधन मस्यौदामा पूर्वाधार लगानीकर्तालाई नयाँ सुरक्षाDraft Company Law Amendment Proposes Stronger Investment Protection for Infrastructure Projects

    NEPSE TRADING

    ·

    2 Jul, 2026

  • Foreign Exchange Rates: Dollar Selling Rate at Rs 151.76, Kuwaiti Dinar the Most Expensive
    Investor

    1 min read

    विदेशी मुद्रा विनिमय दर : डलरको बिक्री मूल्य १५१.७६ रुपैयाँ, कुवेती दिनार सबैभन्दा महँगोForeign Exchange Rates: Dollar Selling Rate at Rs 151.76, Kuwaiti Dinar the Most Expensive

    Dipesh Ghimire

    ·

    1 Jul, 2026