NEPSEtrading

Make smarter moves backed by machine learning. Join thousands of traders leveraging AI to maximize profits.

nepsetrading.com is an online news portal that provides insights into trading and investment by analyzing the stock market and the global economy. We create charts based on the analysis of various indicators. Please do not rely solely on this information for investment decisions. Self-study is crucial. Use this information only as an educational and informational resource.

Marketminds Investment Group Private Limited

DOIB Registration certificate no.: 4680-2081/2082

Director & Editor-in-chief: Dipesh Ghimire · 9802363868, 9851119988

Koteshwor 32, Kathmandu
01-5253221 · +977 9709066745

Contact support

Subscribe to our newsletter

Weekly insights from the NEPSE market in your inbox.

Get the app

Track markets, signals and alerts from your phone.

Get it onGoogle Play

Market

  • Stocks
  • Sectors

Company

  • About Us
  • Our Team
  • Terms of Use
  • Our Policy
  • Training
  • Contact Us

Help

  • Support
  • Report
  • FAQ

© 2026 nepsetrading.com. All rights reserved.
Owned and operated by Marketminds Investment Group Private Limited.

Charts powered by TradingView

  1. News
  2. Investor
  3. NEPSE Index Ends the Week in Decline, RSI is at 38.62
नेप्से परिसूचकमा साप्ताहिक गिरावट : RSI ३८.६२ विन्दुमा
Investor
1 min read
Published on September 6, 2025
NEPSE TRADING

नेप्से परिसूचकमा साप्ताहिक गिरावट : RSI ३८.६२ विन्दुमा NEPSE Index Ends the Week in Decline, RSI is at 38.62

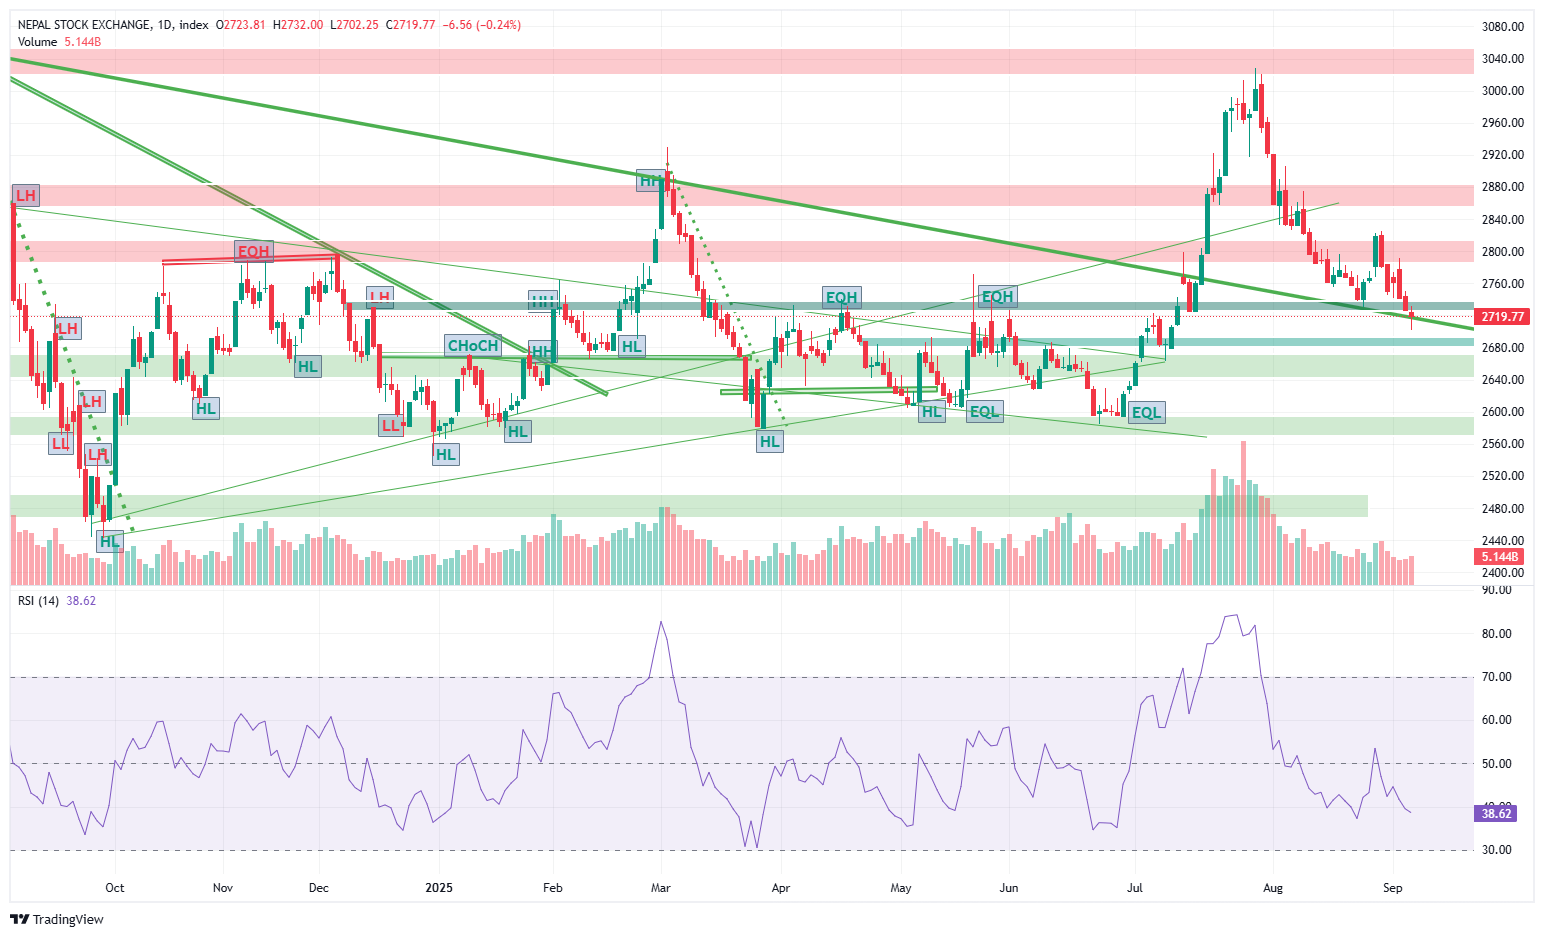
नेप्से परिसूचक यस साताको अन्तिम कारोबार दिनमा २,७१९.७७ विन्दुमा बन्द भएको छ । यसअघि गएको साताको अन्त्यमा परिसूचक २,७८१ विन्दुमा रहेकामा यो सातामा ६१.२३ अङ्कले (२.२०%) घटेको हो।

उच्च–न्यून स्तर र कारोबार

साताभरि नेप्से परिसूचकले २,७९१.६७ विन्दुको उच्च र २,७०२.२५ विन्दुको न्यून स्तर छोयो। यस क्रममा ८९.४२ अङ्कको उतार–चढाव (volatility) देखियो। अघिल्लो सातामा यो उतार–चढाव ९४.११ अङ्क रहेको थियो।

आइतबारको कारोबार दिनमा मात्र ३१.७१ अङ्कको उच्चतम गिरावट भयो र सो दिन कारोबार रकम रु. ६ अर्ब ६ करोड पुगेको थियो। यसैगरी, साप्ताहिक कुल कारोबार रु. २५ अर्ब ४७ करोडमा सीमित रह्यो।

प्राविधिक सूचकांक

दैनिक चार्टअनुसार RSI (Relative Strength Index) ३८.६२ विन्दुमा छ भने साप्ताहिक चार्टमा RSI ४९.०७ विन्दुमा देखिएको छ। यसले बजारमा कमजोर मोमेंटम रहेको संकेत गरेको छ।

MACD सूचकाङ्क -२१.३२ विन्दुमा नकारात्मक क्षेत्रमा छ। MACD र सिग्नल लाइन दुवै नकारात्मक क्षेत्रमा रहेकाले बजारमा अझै बेच्ने दबाब (bearish momentum) कायम रहेको बुझिन्छ।

साथै, नेप्से परिसूचक हाल २० दिनको Exponential Moving Average (EMA) र ५ दिनको EMA भन्दा तल छ। छोटो अवधिको EMA भन्दा परिसूचक तल रहनु बजारमा प्रारम्भिक नकारात्मक भावनाको संकेत हो।

समर्थन र प्रतिरोध

विश्लेषकहरूको अनुमानअनुसार, २,७०० देखि २,६८० विन्दु नजिकै बजारलाई तत्कालीन समर्थन (support) बन्न सक्नेछ भने २,८६० देखि २,८२० विन्दुमा प्रमुख प्रतिरोध (resistance) रहनेछ।

Kathmandu – The NEPSE Index closed at 2,719.77 points at the end of this week, dropping by 61.23 points (2.20%) compared to last week’s close of 2,781 points.

Highs, Lows, and Turnover

Throughout the week, the index touched a high of 2,791.67 points and a low of 2,702.25 points, showing a weekly volatility of 89.42 points. In the previous week, volatility was slightly higher at 94.11 points.

The sharpest intraday loss came on Sunday, with the index falling by 31.71 points, while the turnover stood at Rs 6.06 Arba. The total weekly turnover amounted to Rs 25.47 Arba.

Technical Indicators

On the daily chart, the Relative Strength Index (RSI) is at 38.62, while on the weekly chart, it stands at 49.07, reflecting weaker market momentum.

Meanwhile, the MACD reading is at -21.32, with both the MACD and Signal lines in the negative zone, indicating ongoing bearish pressure.

The NEPSE Index also remains below both the 20-day Exponential Moving Average (EMA) and the 5-day EMA. Closing below shorter-term averages signals early bearish sentiment in the market.

Support and Resistance Levels

Analysts expect the 2,700 – 2,680 range to act as the nearest support zone, while the 2,860 – 2,820 range is likely to serve as a major resistance zone.

the market showed pressure and weakness this week. The index’s ability to hold around the 2,700 support level in the coming days will be crucial in determining the next market direction.

Trending News

  • Trending2 Jul, 2026

    नेप्सेको आजको चार्टले के भन्छ : सन्तुलनको धरातलमा उभिएको बजारNEPSE Forms Hammer at Weak Low: Technical Signals Hint at Possible Turnaround, But Confirmation Still Pending

    Read news
  • Trending2 Jul, 2026

    चीनको बेइजिङमा नेपाल लगानी सम्मेलन, २०० भन्दा बढी लगानीकर्ता सहभागी हुनेNepal Investment Conference Begins in Beijing, Over 200 Investors Expected

    Read news
  • Trending2 Jul, 2026

    सरकारको १०० दिनमा आर्थिक सुधारको सकारात्मक संकेत देखिएको दाबीGovernment Claims Early Economic Gains Amid Reform Drive

    Read news

Related News

  • NEPSE Forms Hammer at Weak Low: Technical Signals Hint at Possible Turnaround, But Confirmation Still Pending
    Investor

    3 min read

    नेप्सेको आजको चार्टले के भन्छ : सन्तुलनको धरातलमा उभिएको बजारNEPSE Forms Hammer at Weak Low: Technical Signals Hint at Possible Turnaround, But Confirmation Still Pending

    NEPSE TRADING

    ·

    2 Jul, 2026

  • Nepal Investment Conference Begins in Beijing, Over 200 Investors Expected
    Top

    1 min read

    चीनको बेइजिङमा नेपाल लगानी सम्मेलन, २०० भन्दा बढी लगानीकर्ता सहभागी हुनेNepal Investment Conference Begins in Beijing, Over 200 Investors Expected

    NEPSE TRADING

    ·

    2 Jul, 2026

  • Government Claims Early Economic Gains Amid Reform Drive
    Top

    2 min read

    सरकारको १०० दिनमा आर्थिक सुधारको सकारात्मक संकेत देखिएको दाबीGovernment Claims Early Economic Gains Amid Reform Drive

    NEPSE TRADING

    ·

    2 Jul, 2026

  • Draft Company Law Amendment Proposes Stronger Investment Protection for Infrastructure Projects
    Investor

    1 min read

    कम्पनी ऐन संशोधन मस्यौदामा पूर्वाधार लगानीकर्तालाई नयाँ सुरक्षाDraft Company Law Amendment Proposes Stronger Investment Protection for Infrastructure Projects

    NEPSE TRADING

    ·

    2 Jul, 2026

  • Foreign Exchange Rates: Dollar Selling Rate at Rs 151.76, Kuwaiti Dinar the Most Expensive
    Investor

    1 min read

    विदेशी मुद्रा विनिमय दर : डलरको बिक्री मूल्य १५१.७६ रुपैयाँ, कुवेती दिनार सबैभन्दा महँगोForeign Exchange Rates: Dollar Selling Rate at Rs 151.76, Kuwaiti Dinar the Most Expensive

    Dipesh Ghimire

    ·

    1 Jul, 2026