साताको दोस्रो कारोबार दिन : लघुवित्त बढ्यो, नेप्से घट्यो, प्रविधिक चाटमा कस्तो देखियो बजार ? The second trading day of the week: Microfinance increased, NEPSE decreased,
साताको दोस्रो कारोबार दिन १३ उपसमूहमध्ये १२ उपसमूहको परिसूचक घटेको छ भने लघुवित्त उपसमूहको परिसूचक उच्च दरमा बढेको छ। यस दिन लघुवित्त उपसमूहको परिसूचक २.४३ प्रतिशतले वृद्धि भएको छ।

कारोबार रकम
यस दिन कुल ३१६ स्टकको ५९ हजार २८५ पटकको कारोबारमा ४ अर्ब ४० लाख रुपैयाँ बराबरको ८८ लाख २० हजार कित्ता शेयर खरिदबिक्री भएको छ।

शेयर मूल्य वृद्धि
बुद्धभूमि नेपाल हाइड्रोपावरको शेयर मूल्य सर्वाधिक ९.९८ प्रतिशतले वृद्धि भएको छ। हिमालयन लघुवित्त, नेशनल लघुवित्त र ग्लोबल आइएमई लघुवित्तको शेयर मूल्य ६ प्रतिशतभन्दा बढीले वृद्धि भएको छ।
शेयर मूल्य
एनआईबिएल स्टेबल फण्डको इकाई नकारात्मक सर्किट लेभलमा कारोबार भएको छ। मनकामना इन्जिनियरिङ्ग हाइड्रोपावरको शेयर मूल्य करिब ६ प्रतिशतले घटेको छ।
नेप्से सूचकांक चार्टको विश्लेषण
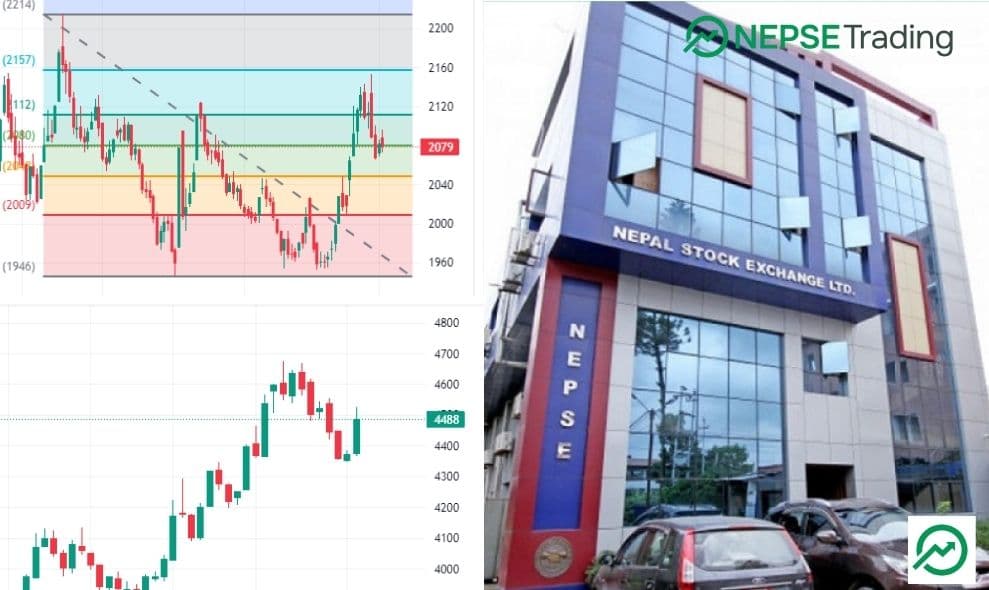
तलको चार्टले नेपाल स्टक एक्सचेन्ज (नेप्से) सूचकांकको प्रदर्शनलाई देखाउँछ। यहाँ हालको बजार अवस्थालाई बुझ्न मद्दत गर्ने विस्तृत प्राविधिक विश्लेषण प्रस्तुत गरिएको छ:

प्रमुख स्तरहरू र संकेतकहरू
1. हालको सूचकांक स्तर: नेप्से सूचकांक २०७९ मा छ, जुन अघिल्लो दिनको तुलनामा २ अंक वा -०.१२% ले घटेको छ।
2. कारोबार मात्रा: कारोबार मात्रा ४.००४ अर्ब रुपैयाँ छ, जसले कूल खरिदबिक्री गरिएको सेयरको मूल्यलाई जनाउँछ।
3. प्रतिरोध र समर्थन स्तरहरू:
- प्रतिरोध स्तरहरू:
- २२१४: यो उच्चतम प्रतिरोध स्तर हो, जसलाई चार्टमा १ को रूपमा चिन्ह लगाइएको छ।
- २१५७: ०.७८६ फिबोनाची रिट्रेसमेन्ट स्तर।
- २११२: ०.६१८ फिबोनाची रिट्रेसमेन्ट स्तर।
- २०८०: ०.५ फिबोनाची रिट्रेसमेन्ट स्तर, हालको सूचकांक स्तरको नजिक।
- समर्थन स्तरहरू:
- २०४१: ०.३८२ फिबोनाची रिट्रेसमेन्ट स्तर।
- २००९: ०.२३६ फिबोनाची रिट्रेसमेन्ट स्तर।
- १९४६: चार्टमा चिन्ह लगाइएको सबैभन्दा कम समर्थन स्तर।
प्रवृत्ति विश्लेषण
- सूचकांकले २०२३ को शुरु देखि महत्वपूर्ण डाउनट्रेंड देखाएको छ, आवधिक पुनरुत्थानहरू सहित।
- हालै, सूचकांकले पुनरुत्थानको संकेत देखाएको छ, अप्रिलको आसपासको डाउनवर्ड प्रवृत्तिलाई तोड्दै र २११२ र २०८० मा प्रतिरोध हान्नु अघि बढ्दै गइरहेको छ।
- फिबोनाची रिट्रेसमेन्ट स्तरहरूले सम्भावित उलटफेर बिन्दुहरू जनाउँछन् जहाँ सूचकांकले समर्थन पाउन सक्छ र पुन: उकालो लाग्न सक्छ वा प्रतिरोधको सामना गर्न सक्छ र घट्न सक्छ।
हालको प्रदर्शन
- सूचकांकले २२१४ को उच्चतम स्तरमा पुगेको छ र त्यसपछि घट्न थालेको छ।
- हालको गिरावटले सूचकांकलाई २०७९ स्तरमा ल्याएको छ, जुन ०.५ फिबोनाची रिट्रेसमेन्ट स्तर (२०८०) नजिक छ। यो स्तर बजारको अर्को आन्दोलनको लागि महत्वपूर्ण बिन्दु हुन सक्छ।
बजार भावना
- बुलिश संकेतहरू: यदि सूचकांक २०८० स्तर माथि तोड्न सफल भयो भने, हेर्नुपर्ने अर्को प्रतिरोध स्तरहरू २११२ र २१५७ हुनेछन्।
- बेयरिश संकेतहरू: यदि सूचकांक २०४१ भन्दा तल झर्छ भने, यसले २००९ र सम्भावित १९४६ को निम्न समर्थन स्तरहरूलाई परीक्षण गर्न सक्छ।
निष्कर्ष
नेप्से सूचकांक हाल एक महत्वपूर्ण बिन्दुमा छ। फिबोनाची स्तरहरूले २०८० र २०४१ बजारको दिशा निर्धारण गर्न महत्त्वपूर्ण स्तरहरू हुन्। यी स्तरहरू माथि वा तल तोडिएमा बजारको अर्को प्रवृत्ति संकेत गर्न सक्छ।
On the second trading day of the week, out of the 13 sub-indices, 12 have decreased, while the Microfinance sub-index has seen a significant rise. The Microfinance sub-index increased by 2.43% on this day.

Trading Volume
On this day, a total of 316 stocks were traded 59,285 times, with a trading volume of NPR 4.40 billion, equivalent to 8.82 million shares traded.

Buddhabhumi Nepal Hydropower's stock price increased the most by 9.98%. Himalayan Microfinance, National Microfinance, and Global IME Microfinance saw their stock prices increase by more than 6%.
NIBL Stable Fund's unit price traded at a negative circuit level. Manakamana Engineering Hydropower's stock price decreased by about 6%.
Analysis of NEPSE Index Chart
The chart above represents the Nepal Stock Exchange (NEPSE) index performance. Here's a detailed technical analysis to help understand the current market situation:

Key Levels and Indicators
1. Current Index Level: The NEPSE index is at 2079, a slight decrease of 2 points or -0.12% from the previous close.
2. Volume: The trading volume is 4.004 billion, indicating the total value of shares traded.
3. Resistance and Support Levels:
- Resistance Levels:
- 2214: This is the highest resistance level, marked as 1 on the chart.
- 2157: The 0.786 Fibonacci retracement level.
- 2112: The 0.618 Fibonacci retracement level.
- 2080: The 0.5 Fibonacci retracement level, close to the current index level.
- Support Levels:
- 2041: The 0.382 Fibonacci retracement level.
- 2009: The 0.236 Fibonacci retracement level.
- 1946: The lowest support level marked on the chart.
Trend Analysis
- The index shows a significant downtrend starting from early 2023, with periodic recoveries.
- Recently, the index has shown signs of recovery, breaking the downward trend around April and continuing to rise until it hits resistance at around 2112 and then 2080.
- The Fibonacci retracement levels indicate the potential reversal points where the index could either find support and bounce back or face resistance and drop.
Recent Performance
- The index reached a high of 2214 before starting to decline.
- The recent decline has brought the index back to the 2079 level, which is very close to the 0.5 Fibonacci retracement level (2080). This could act as a critical point for the next market movement.
Market Sentiment
- Bullish Signals: If the index manages to break above the 2080 level, the next resistance levels to watch will be 2112 and 2157.
- Bearish Signals: If the index falls below 2041, it could test the lower support levels at 2009 and potentially 1946.
Conclusion
The NEPSE index is currently at a crucial point. The Fibonacci levels indicate that 2080 and 2041 are critical levels to watch for determining the market's next direction. A break above or below these levels could signal the next trend in the market.


