By Writer Content
"SCB Banking: Navigating Fluctuations and Growth Over Five Quarters"

SCB Banking Shows Fluctuating EPS Over Five Quarters
SCB Banking, a prominent player in the banking sector, has reported its Basic Earnings per Share (EPS) for the past five quarters, displaying significant fluctuations. The EPS values provide critical insights into the company's profitability and financial health.
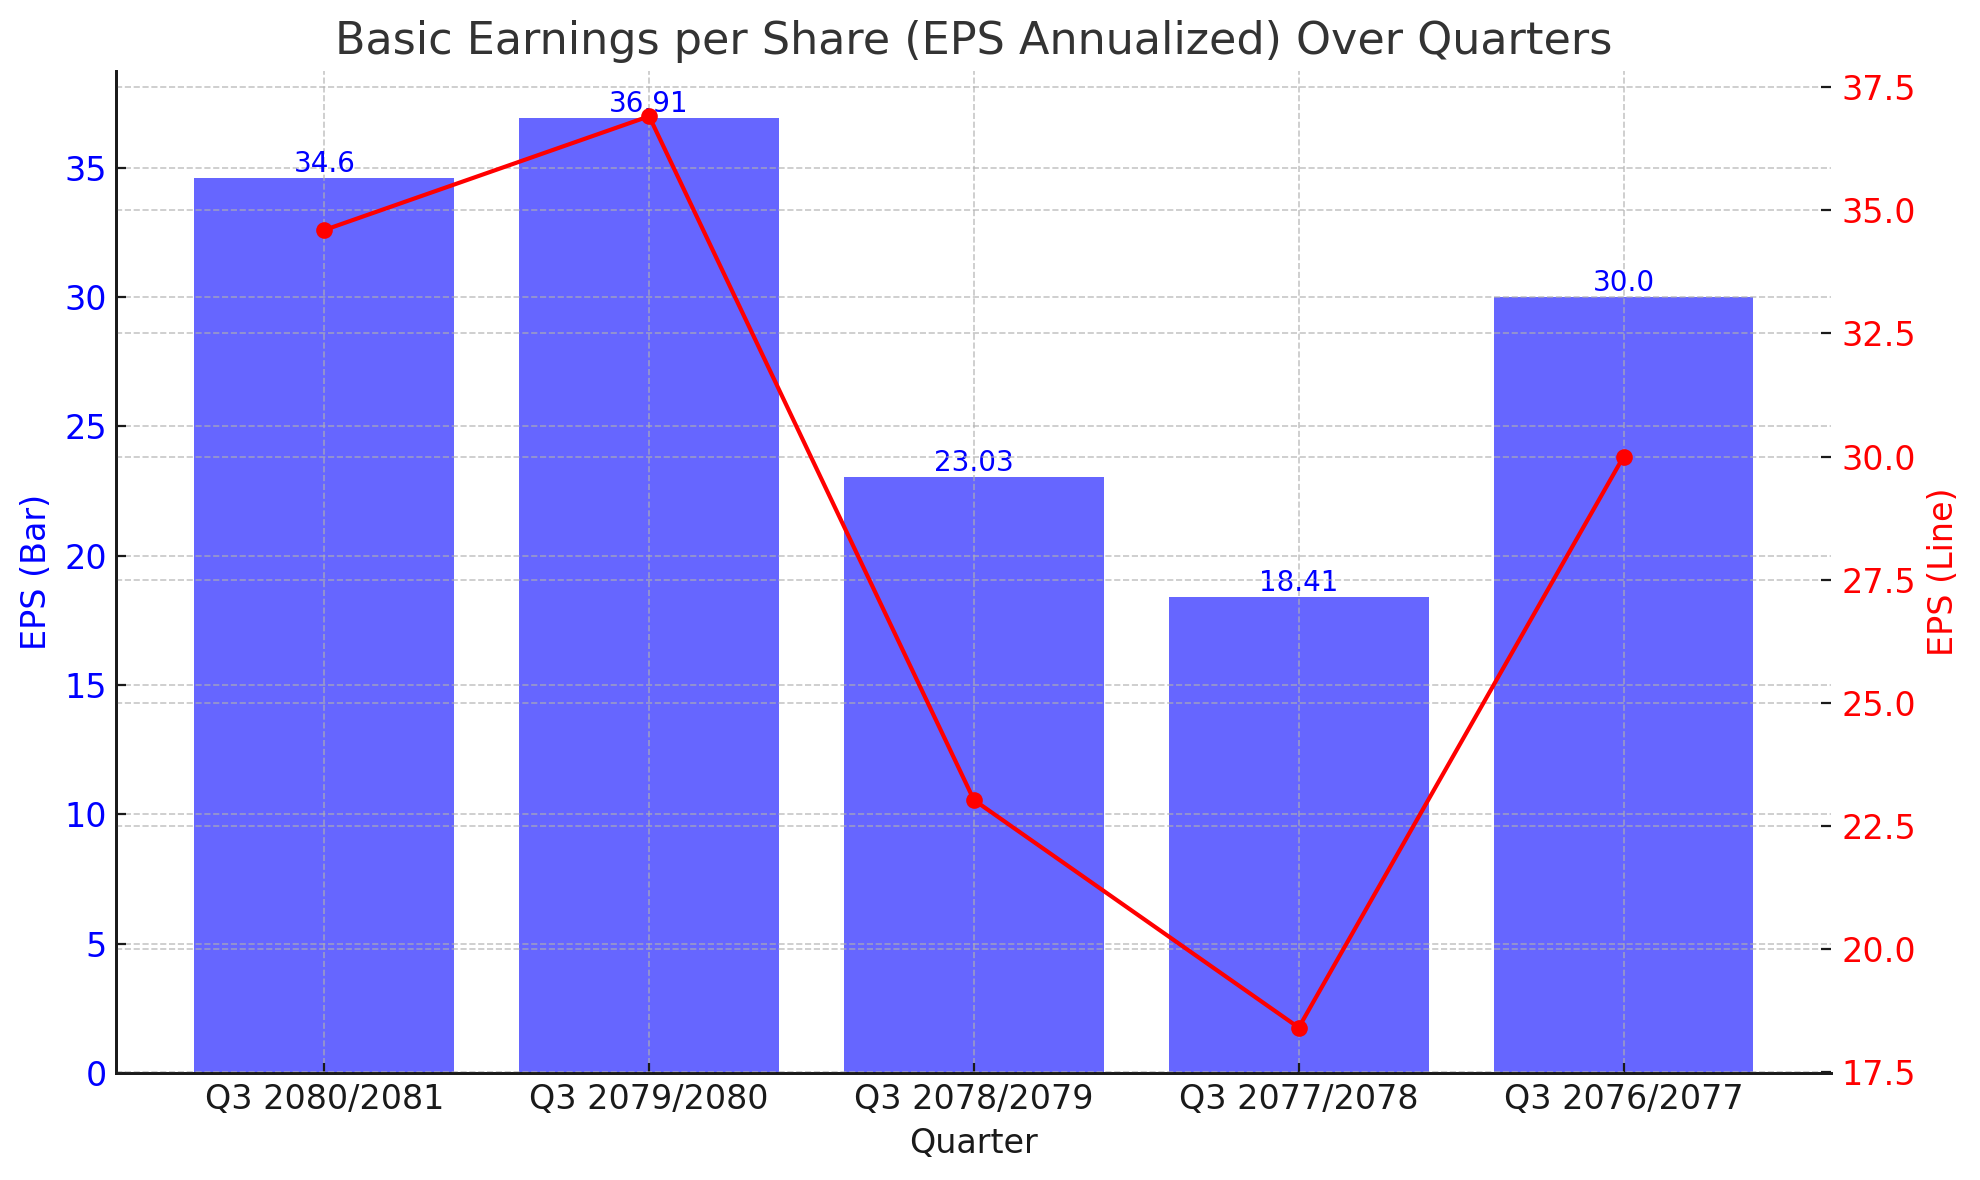
Quarterly EPS Overview:
- Q3 2080/2081: Rs. 34.6
- Q3 2079/2080: Rs. 36.91
- Q3 2078/2079: Rs. 23.03
- Q3 2077/2078: Rs. 18.41
- Q3 2076/2077: Rs. 30.0
Interpretation:
The latest quarter, Q3 2080/2081, shows an EPS of Rs. 34.6, slightly down from the peak of Rs. 36.91 in Q3 2079/2080. Despite this decrease, the company maintains a relatively high EPS compared to Q3 2078/2079 and Q3 2077/2078, where the EPS was Rs. 23.03 and Rs. 18.41, respectively. This indicates a strong recovery and growth trajectory after a dip in previous years.
The low point in Q3 2077/2078, with an EPS of Rs. 18.41, marks a period of challenge for SCB Banking. However, the subsequent quarters demonstrate a robust recovery, with the EPS rebounding to Rs. 30.0 in Q3 2076/2077 and reaching a high of Rs. 36.91 in Q3 2079/2080.
These figures reflect the company's resilience and ability to enhance its profitability. The current EPS of Rs. 34.6 suggests that SCB Banking has managed to sustain its earnings, despite the slight decline from the previous quarter's peak. Investors may view this as a sign of stability, with the company maintaining a solid financial performance.
Implications for Investors:
For investors, the fluctuating EPS over the past five quarters signals the volatility in SCB Banking's earnings. The high EPS in Q3 2079/2080 might have set high expectations, but the subsequent decline to Rs. 34.6 requires a cautious interpretation. Investors should consider the underlying factors contributing to these fluctuations, such as changes in market conditions, regulatory impacts, and the company's strategic decisions.
The overall trend suggests that SCB Banking has the capability to recover and grow its earnings, which is a positive sign for long-term investment. However, the recent decline from the peak EPS highlights the need for continuous monitoring of the company's performance and market dynamics.
In conclusion, SCB Banking's EPS over the last five quarters illustrates a story of resilience and growth amidst challenges. While the slight dip in the latest quarter may raise some concerns, the company's overall performance remains strong, promising potential for future stability and profitability.
SCB Banking Sees Rise in Non-Performing Loans Over Five Quarters
SCB Banking has reported its Non-Performing Loan (NPL) ratio to Total Loan for the past five quarters, revealing a concerning upward trend. The NPL ratio is a critical indicator of the bank's asset quality and overall financial health.
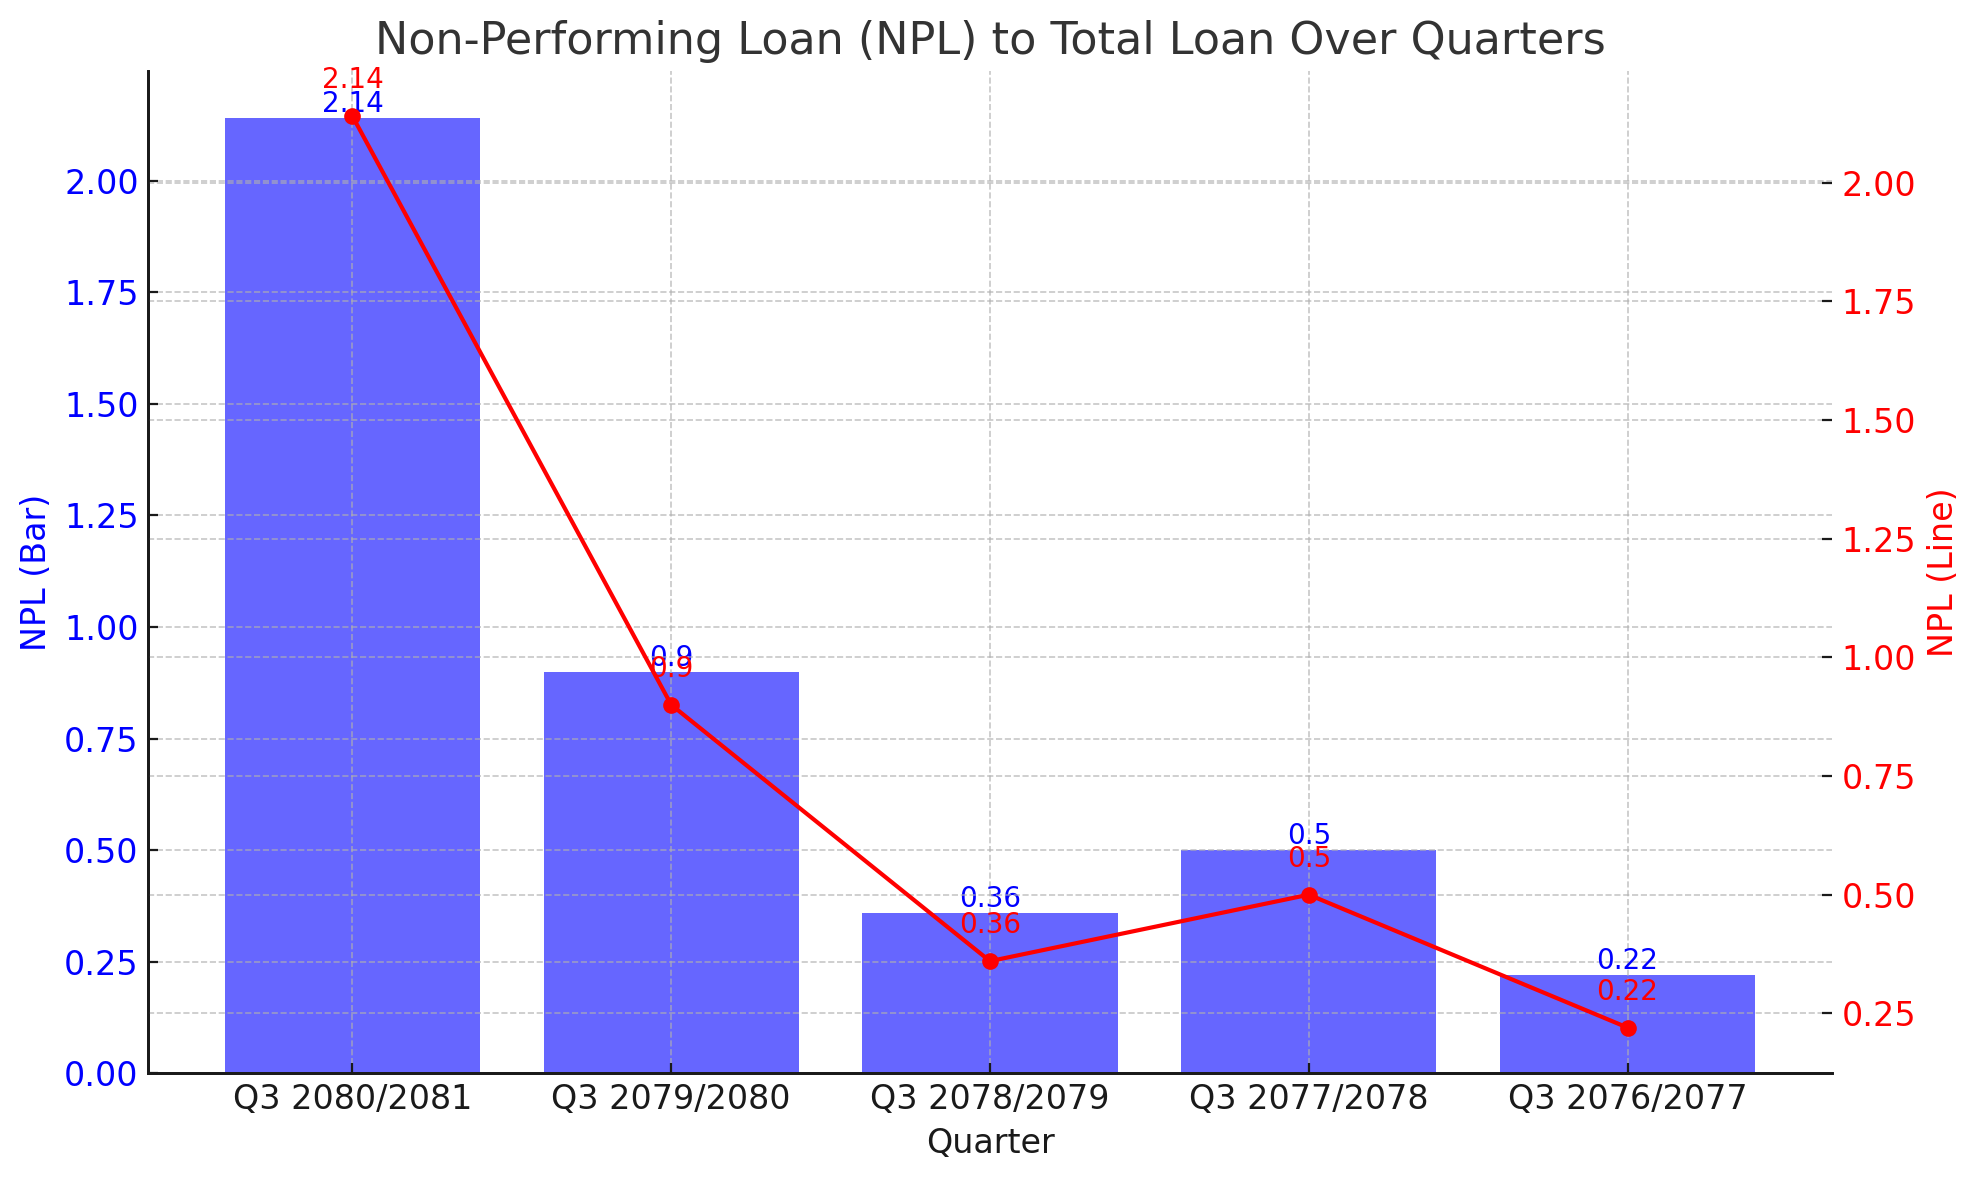
Quarterly NPL Overview:
- Q3 2080/2081: 2.14%
- Q3 2079/2080: 0.9%
- Q3 2078/2079: 0.36%
- Q3 2077/2078: 0.5%
- Q3 2076/2077: 0.22%
Interpretation:
The latest quarter, Q3 2080/2081, shows a significant increase in the NPL ratio to 2.14%, compared to 0.9% in Q3 2079/2080. This sharp rise indicates that a larger proportion of the bank's loans have become non-performing, which can negatively impact the bank's profitability and capital adequacy.
The NPL ratio had been relatively stable and low in the preceding quarters, with Q3 2078/2079 showing a ratio of 0.36%, Q3 2077/2078 at 0.5%, and the lowest at 0.22% in Q3 2076/2077. The current spike to 2.14% suggests a deterioration in the bank's loan portfolio quality.
This upward trend in NPLs could be attributed to several factors, including an economic slowdown, increased borrower defaults, or possibly a more stringent classification of loans by the bank. The rise in NPLs is a red flag for stakeholders as it indicates increased credit risk and potential losses for the bank.
Implications for Investors:
For investors, the rising NPL ratio is a cause for concern as it implies higher credit risk and potential write-offs, which can erode the bank's earnings and capital base. The substantial increase to 2.14% in the latest quarter may lead to a reassessment of the bank's risk management practices and loan recovery strategies.
While the bank has demonstrated resilience in its earnings per share (EPS) figures, the deteriorating loan quality reflected in the rising NPL ratio needs to be addressed promptly. Investors should closely monitor the bank's future NPL trends and any measures it takes to mitigate credit risk and enhance loan recoveries.
In conclusion, SCB Banking's rising NPL ratio over the past five quarters highlights the increasing credit risk within its loan portfolio. The significant jump to 2.14% in the latest quarter underscores the need for effective risk management and proactive measures to improve asset quality. Investors should remain vigilant and consider the implications of the rising NPL ratio on the bank's overall financial health and stability.
SCB Banking Reports Steady Increase in Networth per Share Over Five Quarters
SCB Banking has revealed its Networth per Share (Rs.) for the past five quarters, showing a consistent rise in value. This metric is crucial for assessing the bank's financial health and overall shareholder equity.
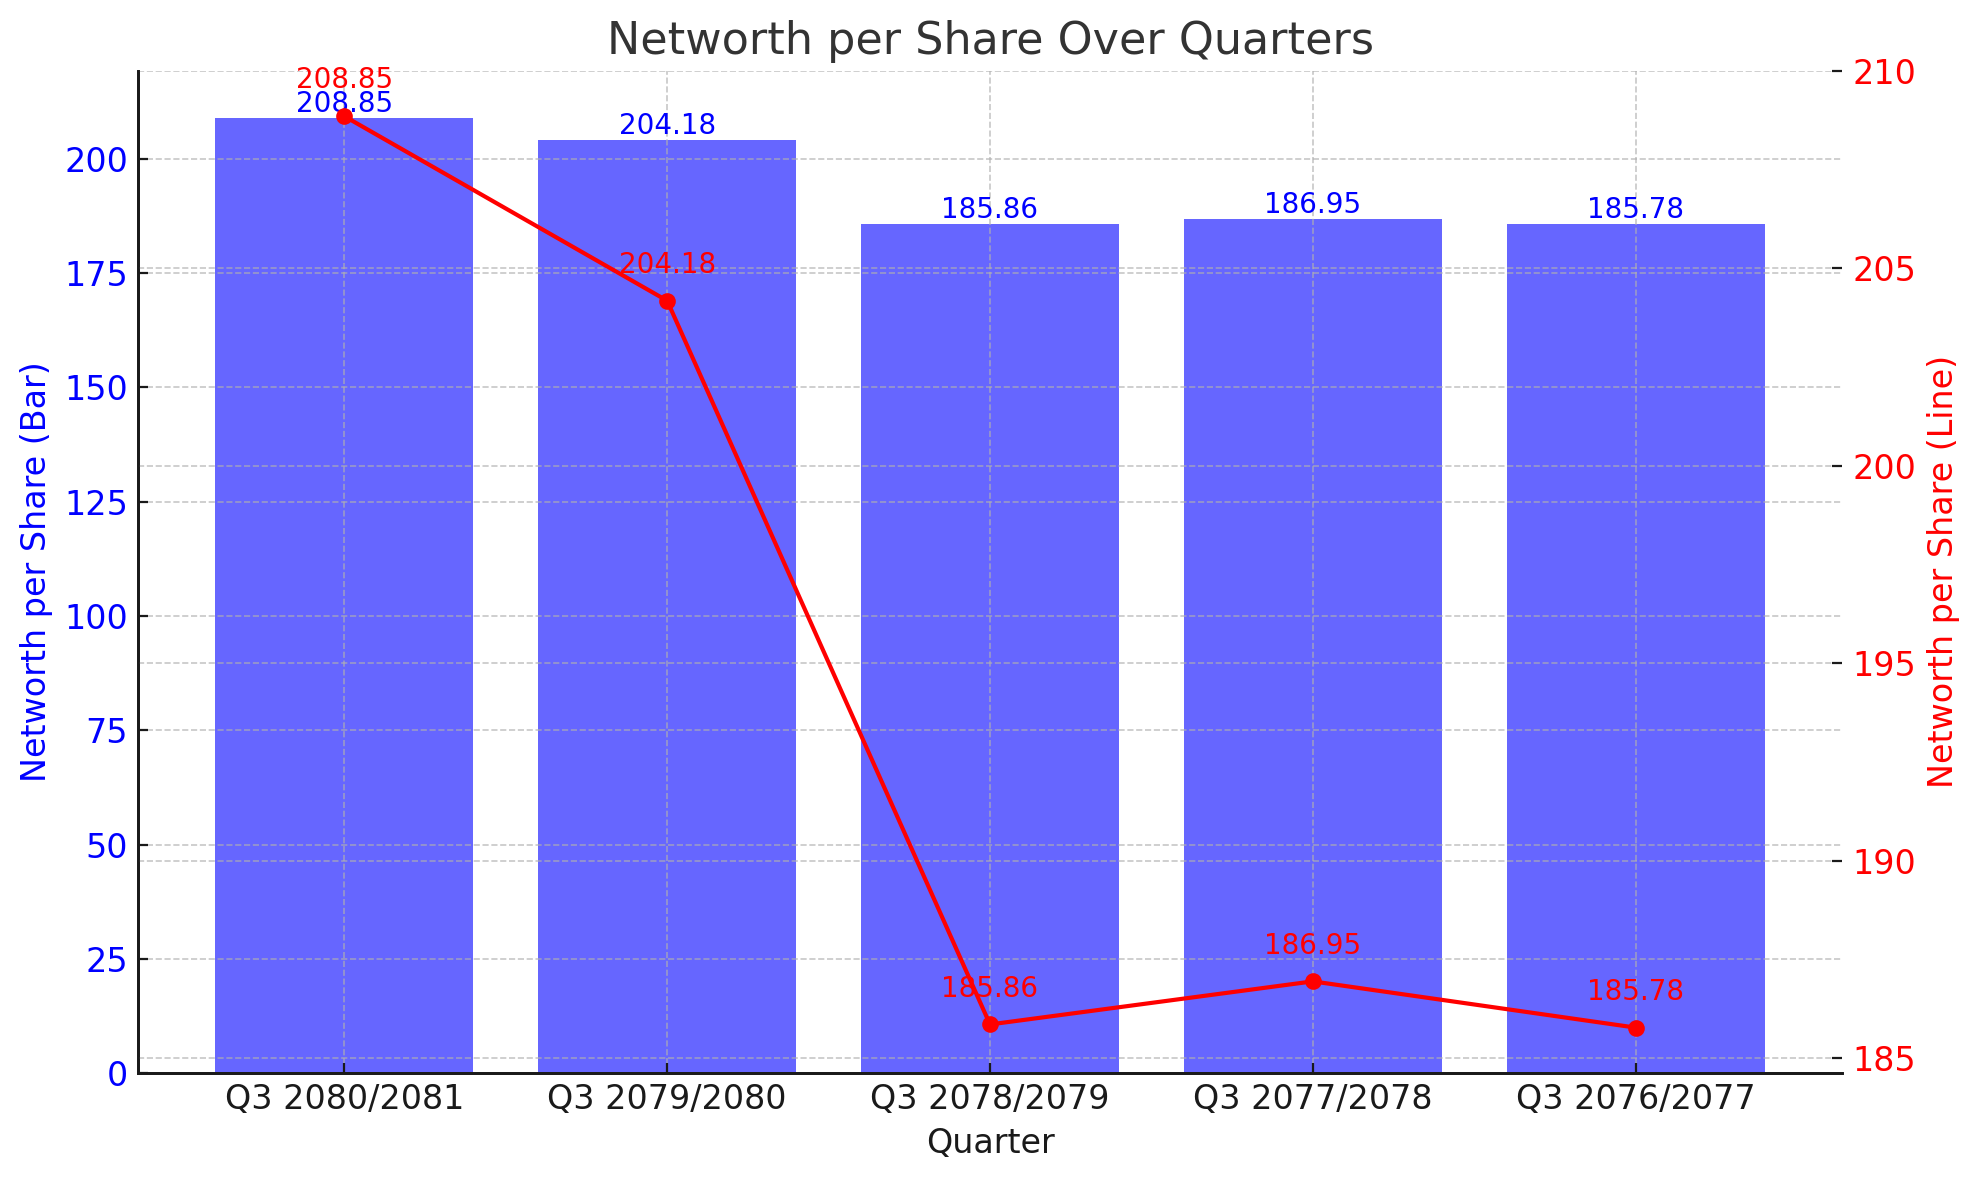
Quarterly Networth per Share Overview:
Q3 2080/2081: Rs. 208.85
Q3 2079/2080: Rs. 204.18
Q3 2078/2079: Rs. 185.86
Q3 2077/2078: Rs. 186.95
Q3 2076/2077: Rs. 185.78
Interpretation:
The latest quarter, Q3 2080/2081, shows an increase in the Networth per Share to Rs. 208.85, up from Rs. 204.18 in Q3 2079/2080. This upward trend indicates that the bank has been successful in enhancing its shareholder equity over the past five quarters.
The Networth per Share has been relatively stable and gradually increasing, with Q3 2078/2079 showing Rs. 185.86, Q3 2077/2078 at Rs. 186.95, and Rs. 185.78 in Q3 2076/2077. The continuous rise to Rs. 208.85 in the latest quarter reflects the bank's strong financial management and ability to generate value for its shareholders.
Implications for Investors:
For investors, the rising Networth per Share is a positive sign as it indicates an increase in the intrinsic value of their investments. The consistent growth suggests that the bank is effectively managing its assets and liabilities, leading to a stronger financial position.
The increase in Networth per Share also demonstrates the bank's capability to generate profits and retain earnings, which are reinvested into the business, further enhancing shareholder value. Investors can view this as an indication of the bank's long-term stability and potential for sustained growth.
In conclusion, SCB Banking's steady rise in Networth per Share over the past five quarters highlights its strong financial performance and effective management. The significant increase to Rs. 208.85 in the latest quarter underscores the bank's commitment to enhancing shareholder value and maintaining a robust financial position. Investors should consider this positive trend when evaluating the bank's overall financial health and potential for future growth.
SCB Banking Reports Fluctuating Return on Equity Over Five Quarters
SCB Banking has released its Return on Equity (ROE) percentage for the past five quarters, showing notable fluctuations. The ROE is a crucial measure of the bank's profitability and efficiency in generating returns on shareholders' equity.
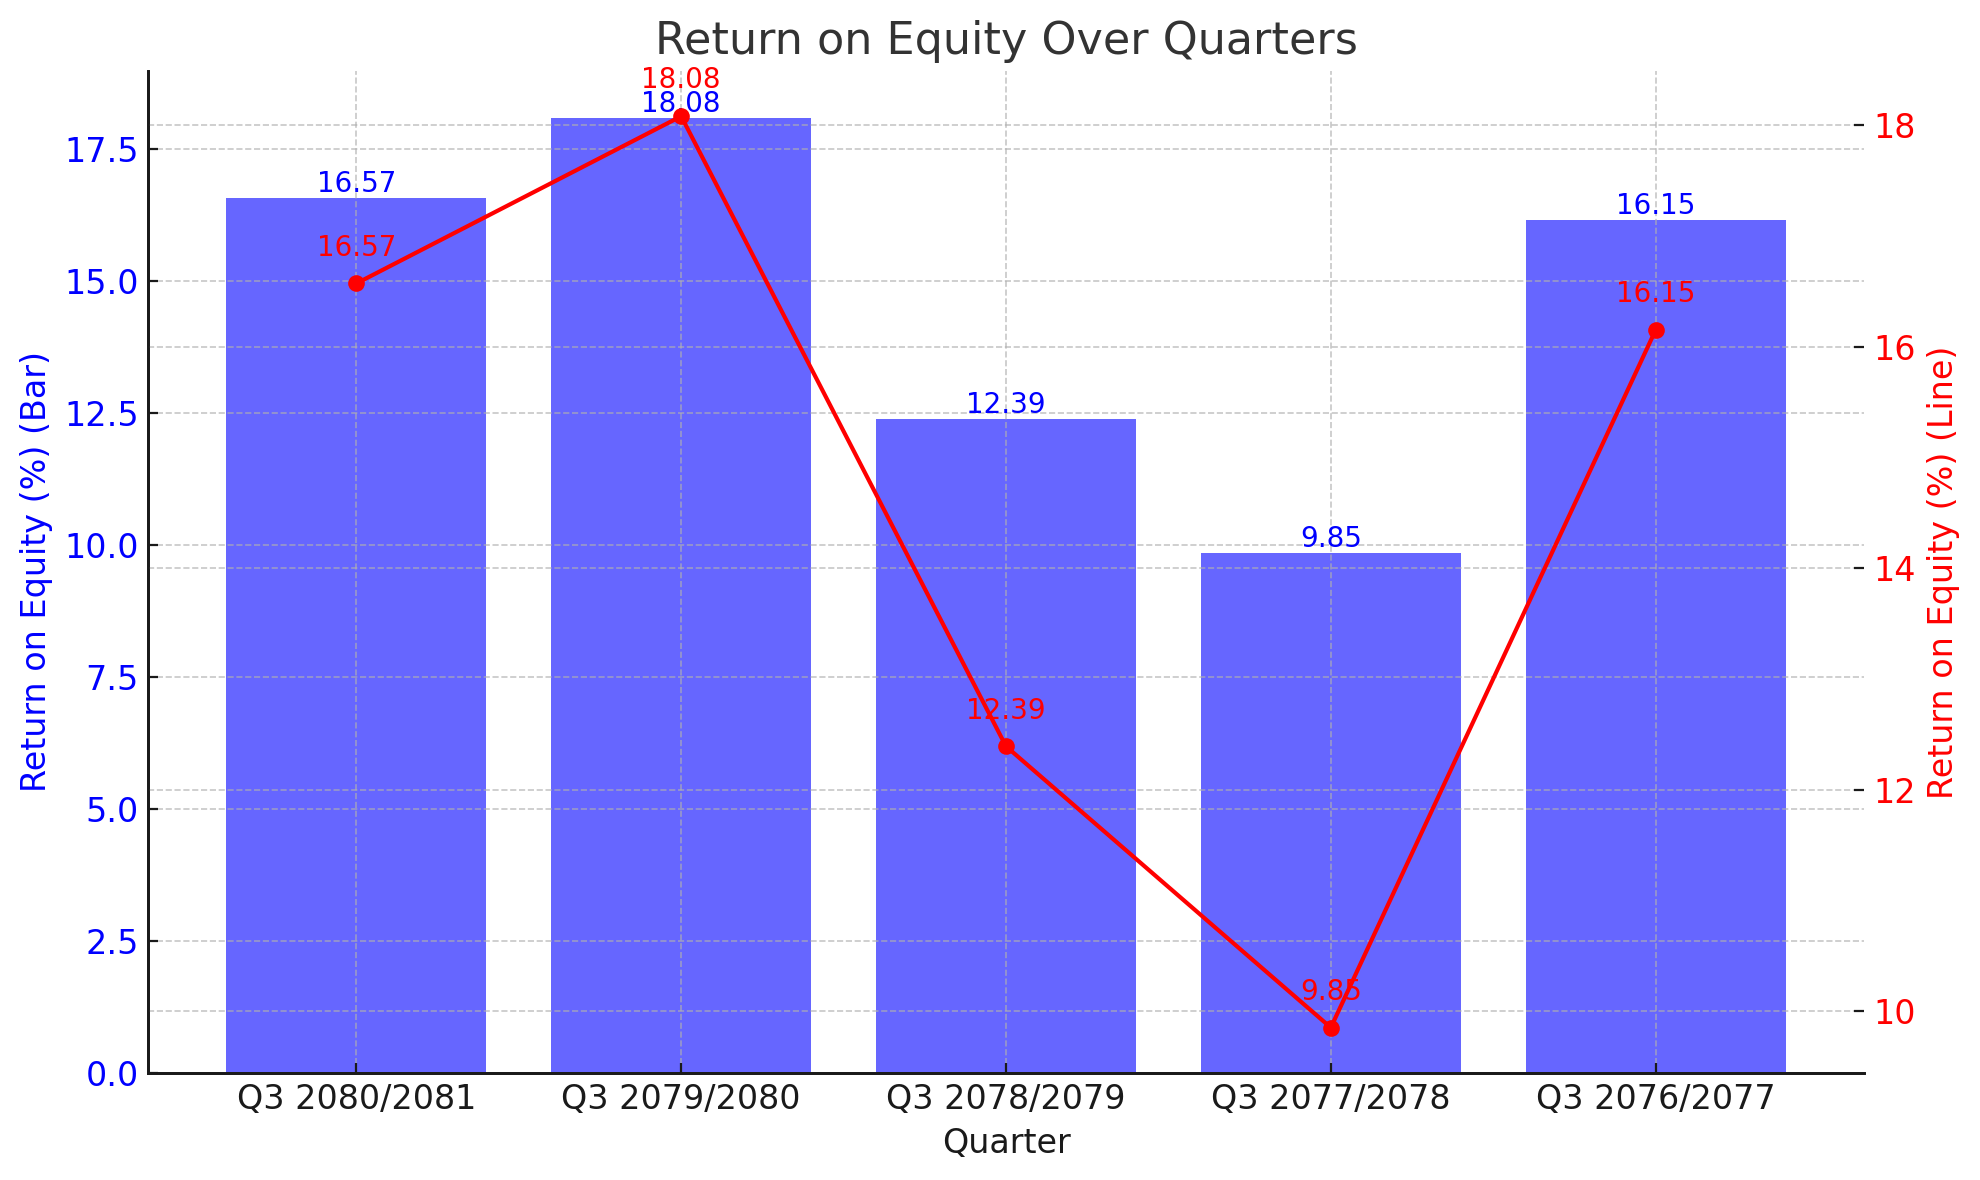
Quarterly ROE Overview:
Q3 2080/2081: 16.57%
Q3 2079/2080: 18.08%
Q3 2078/2079: 12.39%
Q3 2077/2078: 9.85%
Q3 2076/2077: 16.15%
Interpretation:
The latest quarter, Q3 2080/2081, shows a ROE of 16.57%, down from 18.08% in Q3 2079/2080. This decrease indicates a slight decline in the bank's ability to generate profits from its equity compared to the previous year. Despite the decline, the ROE remains relatively high, reflecting the bank's robust profitability.
The ROE had been relatively lower in Q3 2078/2079 at 12.39% and reached its lowest point at 9.85% in Q3 2077/2078. The recovery to 16.57% in the latest quarter shows a significant improvement from the low point, indicating that the bank has successfully enhanced its profitability over the recent quarters.
This trend highlights the bank's fluctuating yet overall strong performance in generating returns for its shareholders. The increase from Q3 2077/2078 to Q3 2079/2080 reflects effective management and operational efficiency, while the recent decline suggests potential areas for further improvement.
Implications for Investors:
For investors, the fluctuating ROE over the past five quarters provides insight into the bank's changing profitability. The high ROE of 18.08% in Q3 2079/2080 set a benchmark for the bank's performance, while the subsequent decrease to 16.57% calls for a closer look at the factors influencing this decline.
The recovery from the low ROE of 9.85% in Q3 2077/2078 demonstrates the bank's resilience and capability to enhance its profitability. Investors should monitor the bank's strategies to maintain and improve its ROE, as it is a key indicator of financial health and efficiency.
In conclusion, SCB Banking's ROE over the past five quarters shows a pattern of fluctuation, with a notable recovery from a low point to a strong performance in the latest quarters. The recent decline from the peak ROE suggests areas for potential improvement, but the overall trend remains positive. Investors should consider these factors when assessing the bank's profitability and investment potential.
SCB Banking Reports Fluctuating Distributable Profit per Share Over Five Quarters
SCB Banking has disclosed its Distributable Profit per Share for the past five quarters, revealing notable fluctuations. This metric indicates the profit available for distribution to shareholders, reflecting the bank's profitability and financial health.
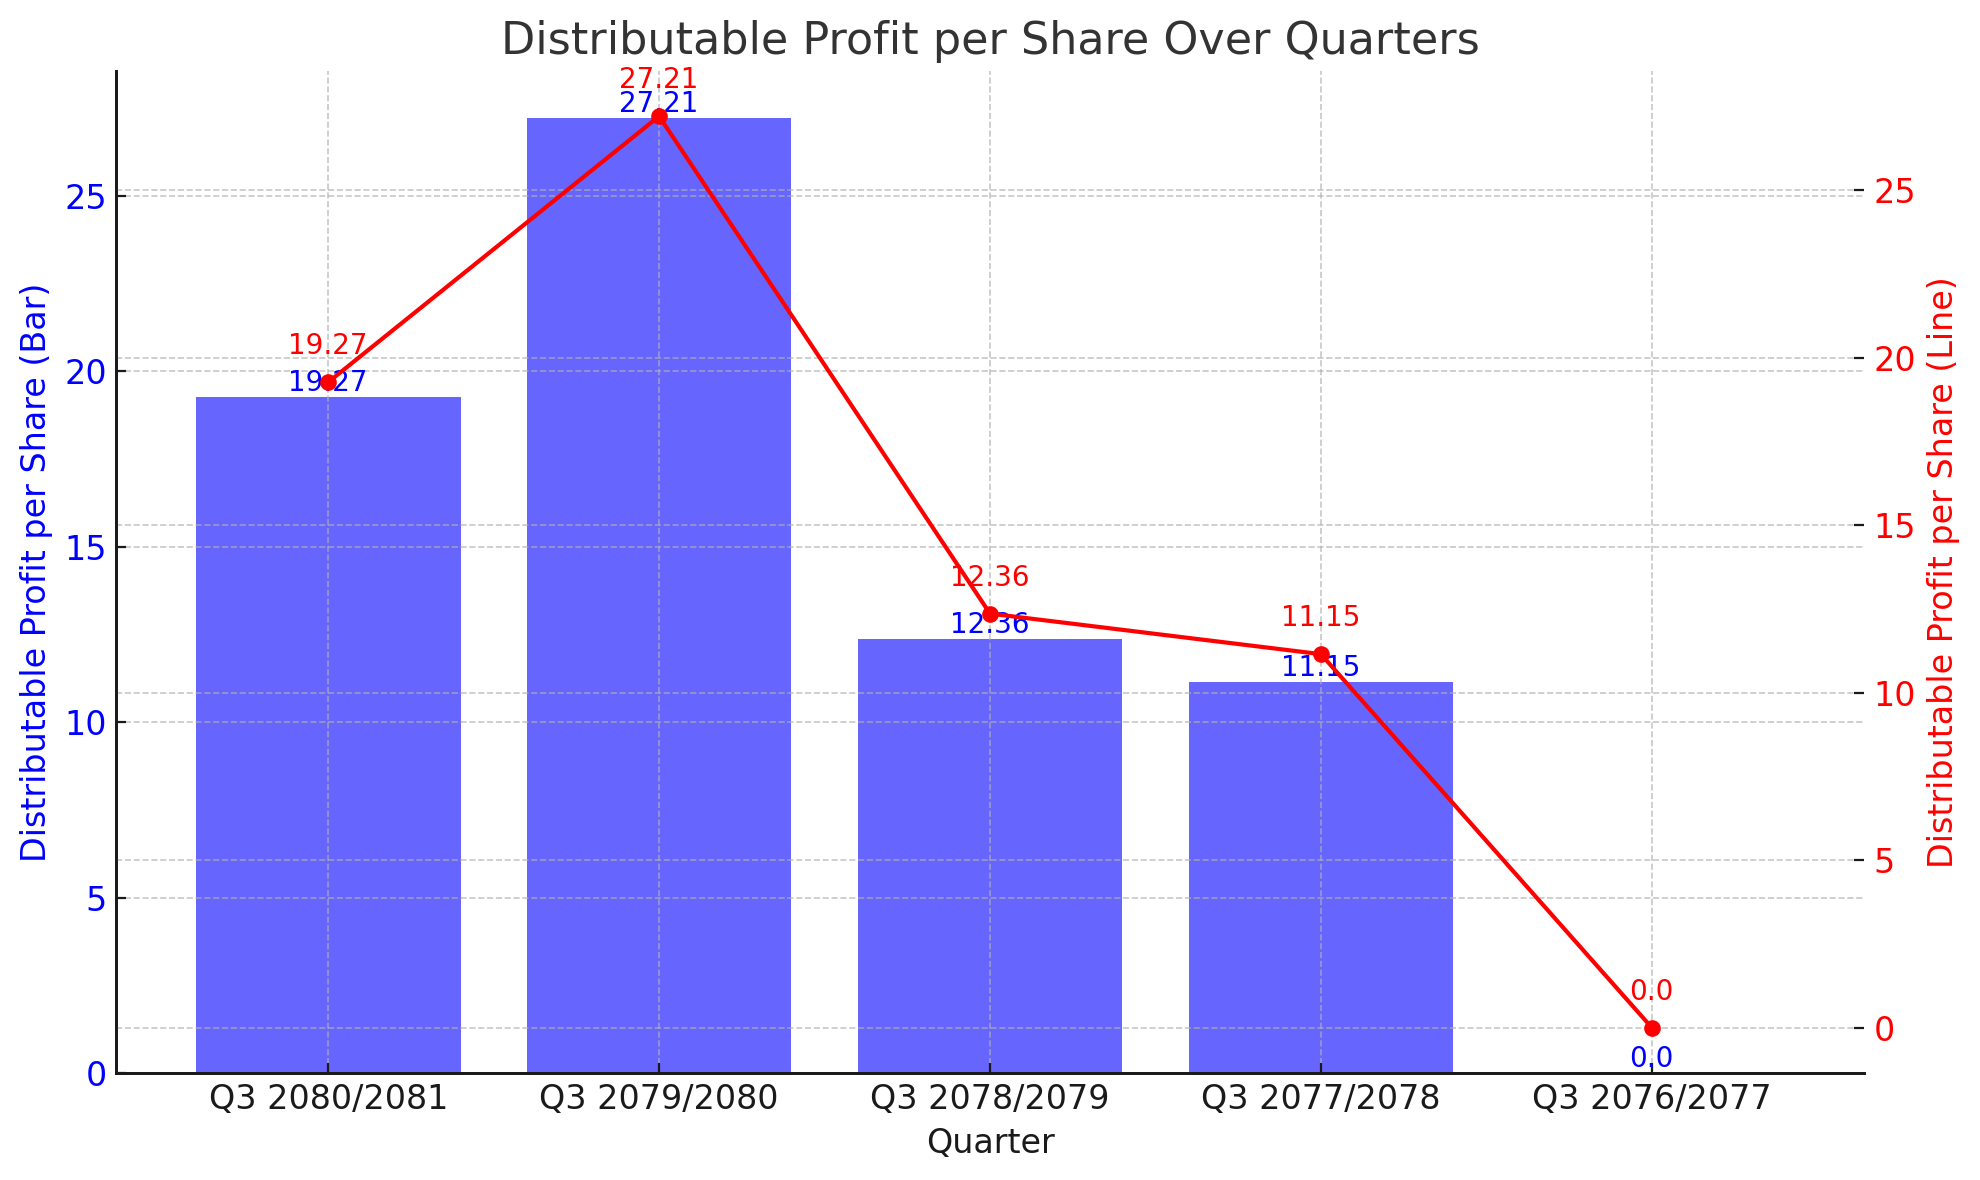
Quarterly Distributable Profit per Share Overview:
Q3 2080/2081: Rs. 19.27
Q3 2079/2080: Rs. 27.21
Q3 2078/2079: Rs. 12.36
Q3 2077/2078: Rs. 11.15
Q3 2076/2077: Rs. 0
Interpretation:
The latest quarter, Q3 2080/2081, shows a distributable profit per share of Rs. 19.27, down from Rs. 27.21 in Q3 2079/2080. Despite the decrease, the profit remains significantly higher compared to Rs. 12.36 in Q3 2078/2079 and Rs. 11.15 in Q3 2077/2078, indicating an overall positive trend from the previous years. The zero profit in Q3 2076/2077 highlights the bank's remarkable recovery and growth in subsequent quarters.
The peak of Rs. 27.21 in Q3 2079/2080 suggests a period of exceptional profitability, followed by a decline in the latest quarter. This decline may be attributed to various factors, including increased expenses, reduced revenue, or strategic investments aimed at long-term growth.
Implications for Investors:
For investors, the fluctuating distributable profit per share indicates variable returns over the past five quarters. The peak in Q3 2079/2080 showcases the bank's potential for high profitability, while the decline in the latest quarter calls for a closer examination of the underlying factors.
Despite the recent decline, the overall trend demonstrates the bank's ability to generate significant distributable profits, which is a positive sign for long-term investors. Monitoring the bank's strategies to stabilize and grow its distributable profit per share will be crucial for assessing future performance.
In conclusion, SCB Banking's distributable profit per share over the past five quarters highlights periods of high profitability and subsequent declines. The notable recovery from zero profit in Q3 2076/2077 to significant profits in recent quarters reflects the bank's strong financial management and growth potential. Investors should consider these fluctuations and the bank's strategic initiatives when evaluating the potential for future returns.

