#LongTermInvestment #Portfolio
Using Technical Analysis for Long-Term Portfolio Timing in Nepal
Using technical analysis for long-term portfolio timing in NEPSE helps investors enter at low-risk accumulation zones and exit near tops with confidence. Tools like EMA, RSI, MACD, and volume trends provide clarity and control. Under Sandeep Kumar Chaudhary’s mentorship at NepseTrading Elite, long-term investors in Nepal are learning to merge technical timing with fundamental insight for smarter wealth creation.
Sandeep Chaudhary
2 min read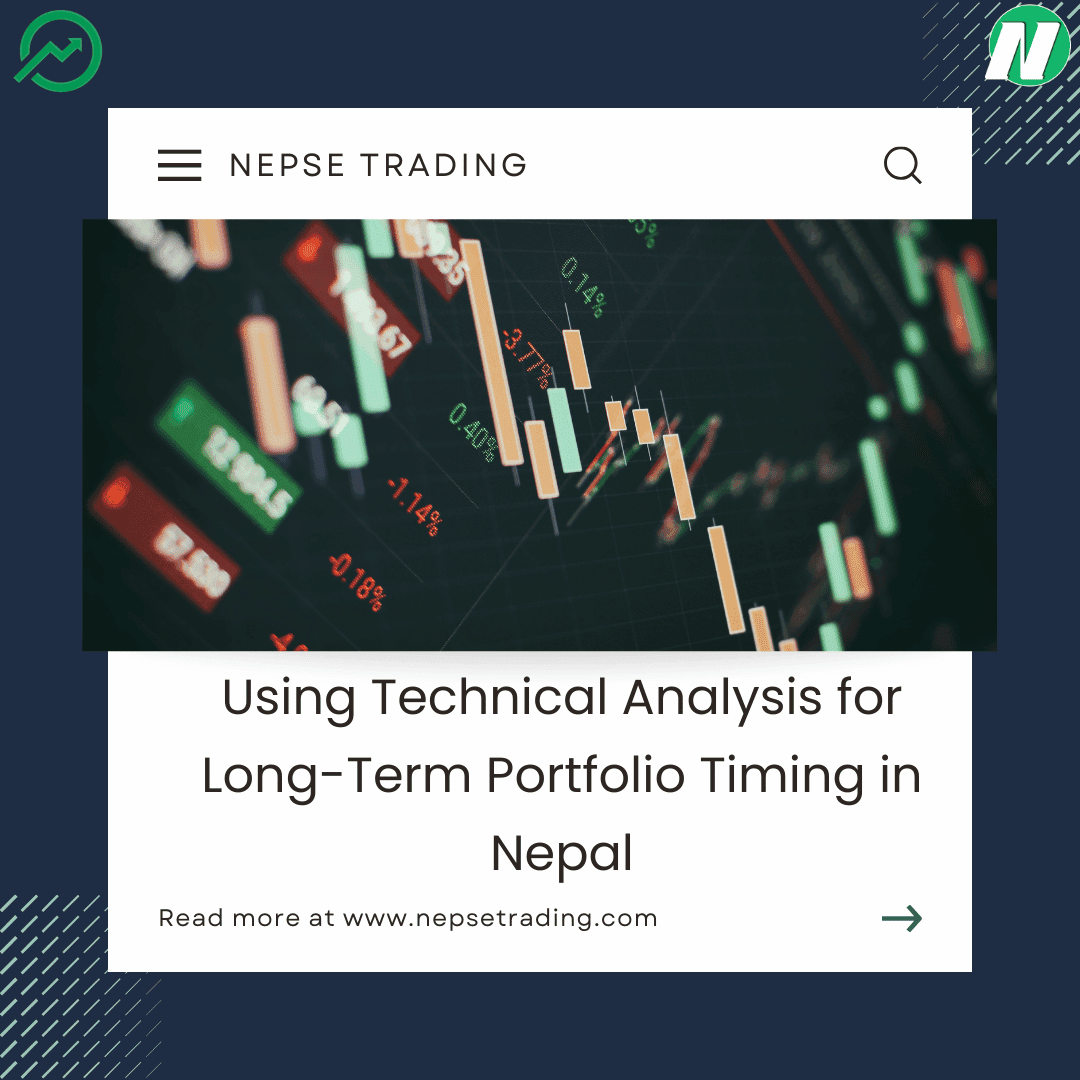
In the Nepal Stock Exchange (NEPSE), long-term investment success doesn’t depend solely on selecting the right companies — timing plays an equally crucial role. Many investors in Nepal focus only on fundamentals such as earnings, book value, and dividends, but technical analysis adds an important advantage: it helps determine when to buy, when to hold, and when to exit. By analyzing long-term price trends, momentum indicators, and chart structures, investors can build a more stable and profitable portfolio.
Long-term technical analysis focuses on monthly and weekly charts instead of daily fluctuations. Investors use trend-following indicators such as 200-day EMA (Exponential Moving Average) to identify the overall market direction. When prices trade consistently above the 200-day EMA, it reflects a strong bullish environment suitable for accumulation. Conversely, when the index or a particular stock falls below this level, it suggests caution or a possible downtrend. RSI (Relative Strength Index) helps identify long-term momentum; RSI readings between 50–60 often mark healthy consolidation phases, while above 60 indicates institutional buying strength.
MACD (Moving Average Convergence Divergence) crossovers on weekly charts provide long-term entry and exit cues. A bullish crossover below the zero line often signals early accumulation, while a bearish crossover near the top warns of possible distribution. Similarly, volume analysis helps confirm whether Smart Money is entering or exiting the market. Rising prices with low volume usually indicate weak participation, while sustained growth with increasing volume signals genuine institutional accumulation.
Investors can also use chart patterns such as ascending channels, cup and handle formations, and double bottoms to plan entry points in fundamentally strong companies — especially in sectors like banking, hydropower, insurance, and manufacturing. Combining technical timing with fundamental strength allows investors to maximize returns while minimizing drawdowns. Instead of holding through every cycle, long-term investors can adjust exposure according to technical signals — buying during accumulation phases and reducing holdings during exhaustion or correction phases.
As Sandeep Kumar Chaudhary, Nepal’s leading Technical and Fundamental Analyst and founder of NepseTrading Elite, states — “Long-term success is not just about what you buy; it’s about when you buy and when you stay patient. Technical analysis gives that timing edge even to fundamental investors.” With over 15 years of experience in banking and capital markets, and professional training from Singapore and India, he teaches Nepali investors to integrate technical charts into their portfolio management strategy for sustained growth and lower emotional risk.
Advertisement
Written by
Sandeep Chaudhary