नेप्सेको आजको चार्टले के भन्छ : सन्तुलनको धरातलमा उभिएको बजारNEPSE Forms Hammer at Weak Low: Technical Signals Hint at Possible Turnaround, But Confirmation Still Pending
बिहीबार बनेको नेप्से परिसूचकको दैनिक चार्टलाई नियाल्दा बजार अहिले निकै संवेदनशील तहमा उभिएको प्रस्ट हुन्छ। एकातिर धेरै महिनादेखिको मन्दी संरचना अझै कायमै छ, अर्कोतिर आजको क्यान्डलले भने त्यही संरचनालाई चुनौती दिने प्रयास गरेको देखिन्छ। यही दोहोरो चरित्रले आजको चार्टलाई विशेष बनाएको छ।
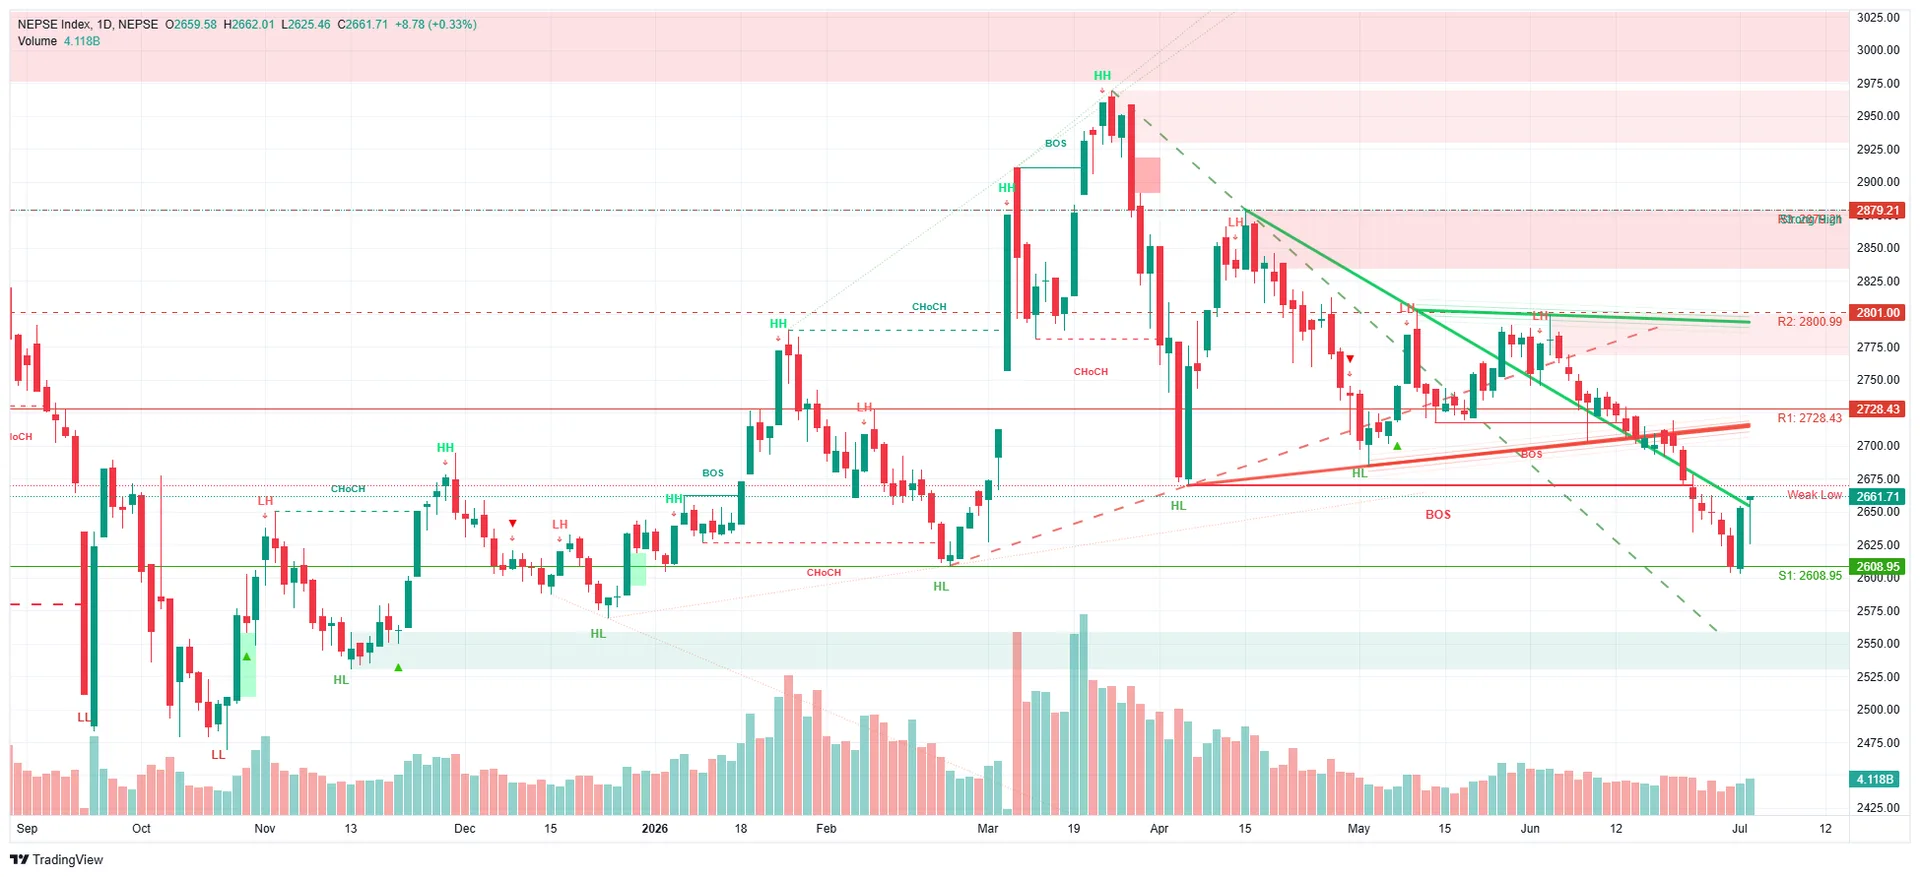
सुरुमा क्यान्डलको बनावट हेरौं। परिसूचक २ हजार ६ सय ५९ बाट कारोबार सुरु भई दिनको तल्लो बिन्दु २ हजार ६ सय २५ सम्म पुगेको थियो। त्यसपछि क्रमशः सुधार हुँदै २ हजार ६ सय ६१ मा बन्द भयो। यसरी दिनको न्यूनतम विन्दुबाट झन्डै ३६ अंकको फड्को मार्दै बन्द हुनुले तल एउटा लामो 'विक' (तल्लो छाया) र माथि सानो शरीर भएको क्यान्डल बनाएको छ। प्राविधिक भाषामा यसलाई 'ह्यामर' भनिन्छ, जुन प्रायः कुनै गिरावटको अन्त्यमा वा महत्त्वपूर्ण समर्थन तहमा देखा पर्दा बजार पल्टिने पूर्वसंकेतका रूपमा लिइन्छ।
अब कुरा गरौं बजार संरचनाको, जुन स्मार्ट मनि कन्सेप्ट (एसएमसी) अन्तर्गत पर्छ। यो विधिले बजारलाई उच्च–निम्न बिन्दुहरूको शृंखलाका आधारमा हेर्छ — 'हायर हाई', 'हायर लो', 'लोअर हाई' र 'लोअर लो'। चार्टमा देखिएअनुसार नेप्से केही महिनायता लगातार 'लोअर हाई' र 'लोअर लो' बनाउँदै तल झरिरहेको छ, जसले मन्दी संरचना (बियरिस स्ट्रक्चर) कायम रहेको पुष्टि गर्छ। हाल बजार त्यही शृंखलाको एउटा नाजुक बिन्दु — 'वीक लो' — मा आइपुगेको छ। यो त्यस्तो तह हो जहाँ बजार वा त बलियोसँग उठ्छ, वा भाँचिएर थप ओरालो लाग्छ।
चार्टमा कोरिएका ढल्केका रेखाहरूले अर्को महत्त्वपूर्ण कथा भन्छन्। माथिबाट तल आउने र तलबाट माथि जाने दुई प्रवृत्ति रेखाले मिलेर एउटा साँघुरिँदो 'वेज' वा त्रिकोणाकार बनावट सिर्जना गरेका छन्। यस्तो बनावट सामान्यतया बजारमा अनिश्चितता घट्दै गई चाँडै ठूलो निर्णय आउनुपर्ने अवस्थाको सूचक मानिन्छ। मूल्य यो त्रिकोणभित्र जति साँघुरिँदै जान्छ, त्यति नै छिट्टै र ठूलो परिमाणमा एकतर्फी चाल (माथि वा तल) आउने सम्भावना बढ्छ।
समर्थन–प्रतिरोधको हिसाबले हेर्दा तल्लो सुरक्षा तह २ हजार ६ सय ८ दशमलव ९५ मा चिन्ह लागेको छ, जुन नजिकैबाट नै आज बजारले फड्को मारेको हो। यसमाथि पहिलो अवरोध २ हजार ७ सय २८ मा र त्यसपछि दोस्रो ठूलो अवरोध २ हजार ८ सय एक हाराहारीमा रहेको छ। धेरै माथि हेर्ने हो भने केही महिनाअघि बनेको सबैभन्दा उच्च बिन्दु झन्डै २ हजार ८ सय ७९ मा अङ्कित छ, जुन हालको अवस्थाबाट निकै टाढा छ।
चार्टले 'सिएचओसिएच' अर्थात् संरचना परिवर्तनका दुई घटना पनि देखाएको छ — एउटा जब तेजी मन्दीमा बदलियो, र अर्को जब मन्दी झनै गहिरियो। यसले के देखाउँछ भने बजारको प्रवृत्ति एकोहोरो होइन, समय–समयमा दिशा बदलिँदै आएको हो। अहिले तेस्रो सम्भावित परिवर्तनको संकेत देखिन थालेको छ, तर यो हालसम्म प्रस्तावमात्र हो — पुष्टिका लागि माथिल्लो प्रतिरोध तोड्नैपर्छ।
'ब्रेक अफ स्ट्रक्चर' अर्थात् संरचना भङ्गका बिन्दुहरूले पनि यही कथालाई बल दिन्छन्। हालसम्मको ब्रेक अफ स्ट्रक्चर मन्दीकै पक्षमा देखिन्छ, अर्थात् बजारले औपचारिक रूपमा अझै तेजी संरचनामा प्रवेश गरिसकेको छैन। तर आजको ह्यामर र सोसँगै देखिएको खरिद चापले यही संरचना भत्काउने प्रयासको सुरुवात भएको आभास दिन्छ।
कारोबार मात्राको दृष्टिले हेर्दा आज ४ अर्ब ११ करोड रुपैयाँभन्दा बढीको कारोबार भएको छ, जुन अघिल्लो दिनहरूको तुलनामा उल्लेख्य वृद्धि हो। प्राविधिक विश्लेषणमा मात्रा एउटा महत्त्वपूर्ण पुष्टिकर्ता तत्व मानिन्छ — कम मात्रामा बनेको ह्यामरभन्दा धेरै मात्रासहितको ह्यामर बढी भरपर्दो हुन्छ, किनभने यसले वास्तविक लगानीकर्ता सहभागिता रहेको देखाउँछ।
समग्रमा हेर्दा आजको चार्टले तत्काल ठूलो तेजीको ग्यारेन्टी दिँदैन, तर एउटा सम्भावित मोडविन्दु नजिकिएको संकेत भने पक्कै दिन्छ। आगामी दिनहरूमा बजारले तल्लो समर्थन (२ हजार ६ सय २५–२ हजार ६ सय ९ को दायरा) माथि नै टिकिरहन सक्यो र क्रमशः माथि बढ्दै २ हजार ७ सय २८ को प्रतिरोध तोड्न सफल भयो भने मात्र संरचनागत परिवर्तन पुष्टि हुनेछ। त्यसो हुन नसकेमा भने हालको सुधार अस्थायी 'प्राविधिक उछाल' मा सीमित रहने जोखिम उत्तिकै रहन्छ।

KATHMANDU. Thursday's daily chart for the Nepal Stock Exchange (NEPSE) index has thrown up a technically significant setup, with the market sitting at a genuinely delicate juncture. On one hand, the broader bearish structure that has dominated recent months remains technically intact. On the other, today's candle appears to be the first real challenge to that structure. It's this tension between an unbroken downtrend and a sudden show of buying strength that makes today's session worth a closer look.
Start with the candle itself. The index opened at 2,659.58, dropped to an intraday low of 2,625.46, and then clawed back to close at 2,661.71, up 8.78 points or 0.33 percent. That's a recovery of roughly 36 points off the day's low — enough to produce a long lower wick with a small body sitting near the top of the day's range. In technical terms, this is a textbook Hammer candle. Hammers typically form after a decline or at a meaningful support level, and are read as an early sign that selling pressure is running out of steam and buyers are starting to step in.
Zooming out to market structure — the framework used in Smart Money Concepts (SMC) — the picture is more cautious. SMC tracks price action through a sequence of swing points: Higher Highs, Higher Lows, Lower Highs, and Lower Lows. On this chart, NEPSE has been printing a consistent series of Lower Highs and Lower Lows for several months, which confirms a bearish structure is still in force. The index has now arrived at what the chart marks as a "Weak Low" — a swing point sitting right at the edge of that bearish sequence. This is typically a make-or-break zone: either buyers defend it and structure begins to shift, or it fails and the downtrend extends.
The trendlines add another layer to the story. Two converging lines — a descending line from the upper swing highs and a rising line from the lower swing lows — have formed a narrowing wedge pattern. Wedges like this are generally read as compression zones: as price gets squeezed into a smaller range, the probability of a sharp breakout — in either direction — increases. The chart suggests NEPSE is now approaching the apex of that wedge, meaning a decisive move, up or down, may not be far off.
On support and resistance, the nearest floor sits at 2,608.95 (marked S1) — a level the index brushed close to today before rebounding. On the upside, the first hurdle is at 2,728.43 (R1), followed by a stronger resistance band around 2,801.00 (R2), with the broader "Strong High" zone from earlier this year marked near 2,879.21. That upper zone remains a long way off from current levels and isn't a near-term consideration.
The chart also flags two Change of Character (CHoCH) events — moments where the prevailing trend shifted, first from bullish to bearish, and later into a deeper bearish leg. This history is a reminder that NEPSE's trend has flipped before and can flip again, but it also underscores that a CHoCH is only confirmed after the fact — right now, what's visible is merely the possibility of a third shift, not proof of one. That proof, if it comes, would need a clean break above R1.
Break of Structure (BOS) markers tell a similar story on the downside — the most recent confirmed BOS still favors the bears, meaning the index hasn't yet delivered the technical evidence needed to call an official trend change. What today's Hammer does offer is a plausible starting point for that shift, not a confirmed one.
Volume is arguably the most reassuring piece of today's data. Turnover crossed Rs 4.11 billion, a noticeable jump from recent sessions. In technical analysis, volume is what separates a credible reversal signal from a false one — a Hammer on thin volume carries little weight, while one backed by strong participation, as seen today, is taken more seriously by chartists.
Put together, today's chart doesn't hand out a guarantee of a sustained rally, but it does mark a genuine point of interest. The next few sessions will be the real test: if NEPSE holds above the 2,625–2,609 support band and grinds higher toward and through the 2,728 resistance, that would go a long way toward confirming a structural shift. Fail to hold that zone, and today's bounce risks being remembered as a one-day technical blip rather than the start of something more durable.