Top3 min readPremium IPO Rush Led by Manufacturing Firms Signals Both Opportunity and Risk in Nepal’s Capital MarketPremium IPO Rush Led by Manufacturing Firms Signals Both Opportunity and Risk in Nepal’s Capital Market Nepal’s capital market is witnessing a growing surge of companies seeking to issue Initial Public Offerings (IPOs) at premium prices, with manufacturing and processing firms taking the lead. According to data from the Nepal Securities Board (SEBON), nearly a dozen companies have applied for permission to sell shares above their face value, reflecting rising corporate confidence as well as increasing pressure on regulators to ensure fair valuation.Dipesh Ghimire·18 Feb, 2026
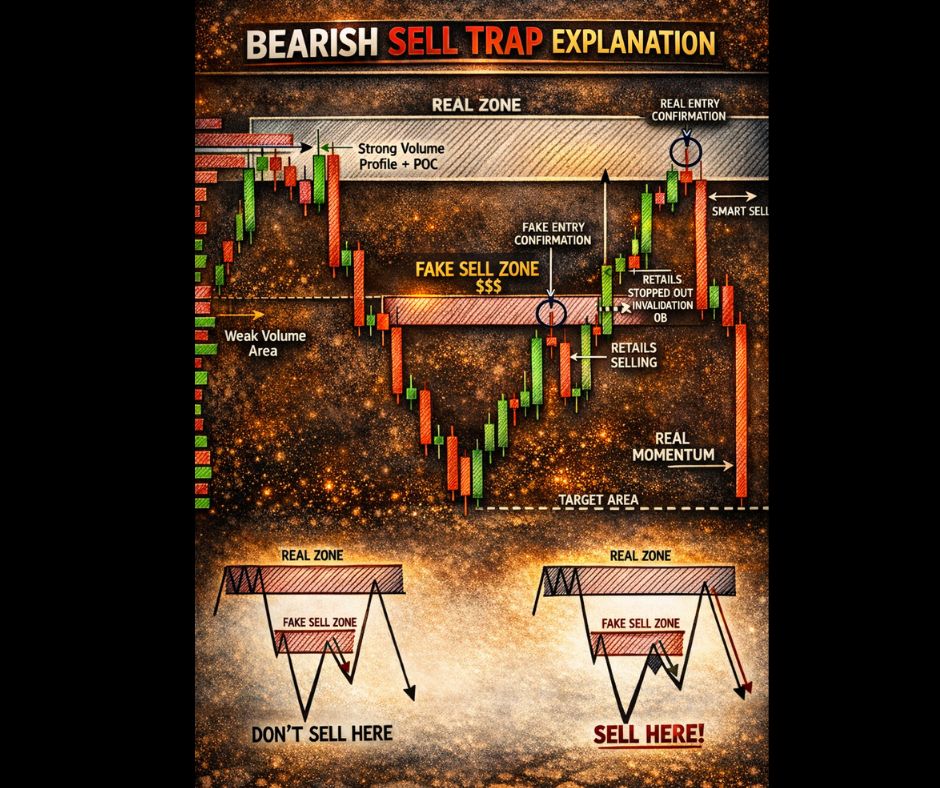
Top2 min readBearish Sell Trap Explained: How Smart Money Outsmarts Retail TradersBearish Sell Trap Explained: How Smart Money Outsmarts Retail Traders A detailed trading illustration titled “Bearish Sell Trap Explanation” is gaining widespread attention among technical analysts and retail investors for revealing how market manipulators and institutional players often trap inexperienced traders into losing positions. The chart visually explains how false breakdowns are created to mislead sellers before the real market move begins. At the start of the diagram, price is shown moving within a Real Zone, an area marked by strong volume profile and Point of Control (POC). This zone represents where large institutions accumulate and distribute positions. High trading volume in this area indicates strong interest from professional market participants.Dipesh Ghimire·18 Feb, 2026
Top2 min readAnatomy of a Short Sale: A Visual Guide to Market ReversalsAnatomy of a Short Sale: A Visual Guide to Market Reversals The AI-enhanced infographic titled “Anatomy of a Short Sale” presents a modern and visually engaging explanation of how market tops are formed and how traders can identify profitable short-selling opportunities. Designed with a professional trading theme, the chart combines technical patterns, volume analysis, and moving averages to illustrate the complete lifecycle of a market reversal. At the beginning of the chart, the Initial First-Stage Base Breakout marks the start of an upward trend. During this phase, price rises from a consolidation zone and moves above the 50-Day Moving Average, signaling growing bullish momentum. This stage often attracts retail investors and fuels optimism in the market.Dipesh Ghimire·18 Feb, 2026
Top2 min readSleeping Positions Reflect Trading Lifestyles in Viral Market IllustrationSleeping Positions Reflect Trading Lifestyles in Viral Market Illustration A humorous yet insightful illustration titled “Sleeping Positions of Different Trading Styles” is gaining popularity across online trading communities for its creative depiction of how various trading approaches affect the daily lives and mental states of investors. Through simple cartoon imagery, the graphic connects trading styles with sleep patterns, highlighting the emotional and psychological impact of market participation. The image presents four characters, each representing a distinct type of trader: Swing Trader, Position Trader, Day Trader, and Scalper. Each figure is shown in a different sleeping posture, symbolizing their level of stress, confidence, and exposure to market risk.Dipesh Ghimire·18 Feb, 2026
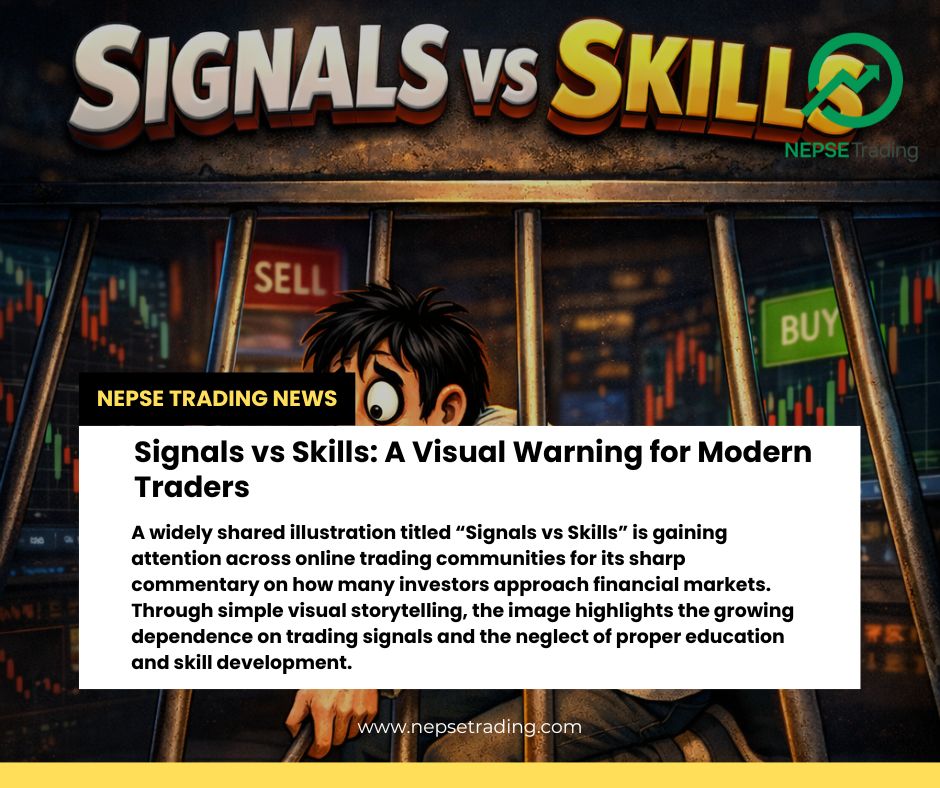
Top2 min readSignals vs Skills: A Visual Warning for Modern TradersSignals vs Skills: A Visual Warning for Modern Traders A widely shared illustration titled “Signals vs Skills” is gaining attention across online trading communities for its sharp commentary on how many investors approach financial markets. Through simple visual storytelling, the image highlights the growing dependence on trading signals and the neglect of proper education and skill development.Dipesh Ghimire·18 Feb, 2026
Top2 min readFrom Confusion to Clarity: The Journey of a Trader Toward MasteryFrom Confusion to Clarity: The Journey of a Trader Toward Mastery A symbolic illustration circulating among trading communities is drawing widespread attention for its powerful message about the realities of success in financial markets. The image portrays two traders at different stages of their journey, using a Rubik’s Cube as a metaphor for market complexity and personal growth. On one side of the illustration, a “New Trader” is shown climbing a steep mountain path, carrying a backpack and using a walking stick for support. His head is represented by an unsolved Rubik’s Cube, symbolizing confusion, uncertainty, and the overwhelming nature of financial markets for beginners. The climb reflects the early struggles traders face—learning technical analysis, managing emotions, coping with losses, and understanding market dynamics.Dipesh Ghimire·18 Feb, 2026
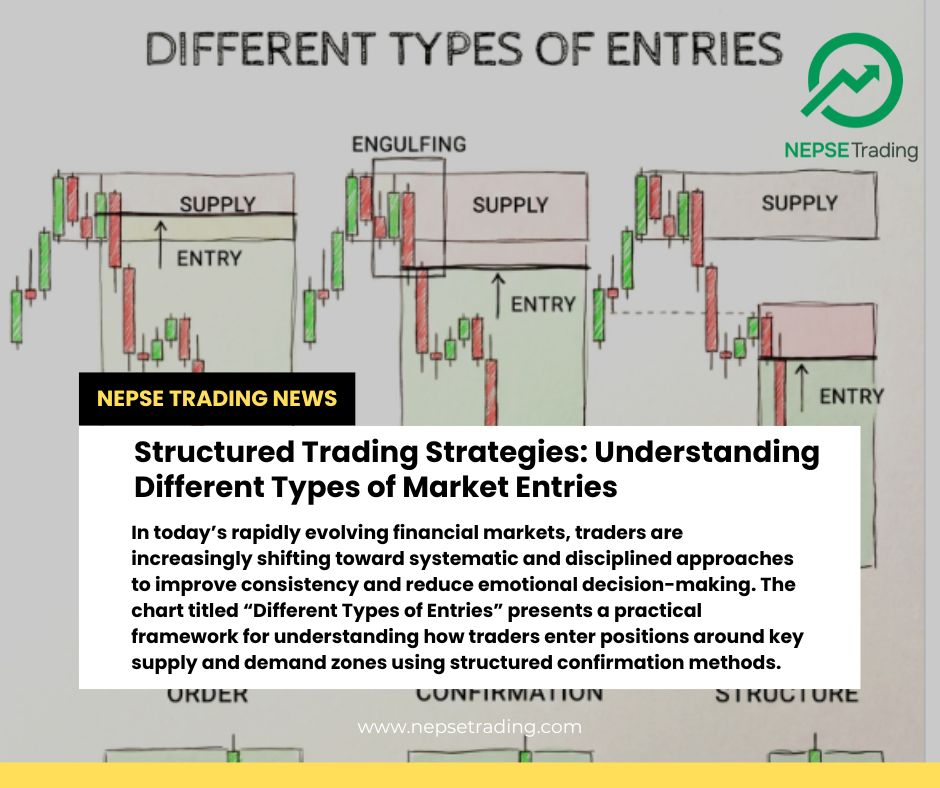
Top2 min readStructured Trading Strategies: Understanding Different Types of Market EntriesStructured Trading Strategies: Understanding Different Types of Market Entries In today’s rapidly evolving financial markets, traders are increasingly shifting toward systematic and disciplined approaches to improve consistency and reduce emotional decision-making. The chart titled “Different Types of Entries” presents a practical framework for understanding how traders enter positions around key supply and demand zones using structured confirmation methods.Dipesh Ghimire·18 Feb, 2026
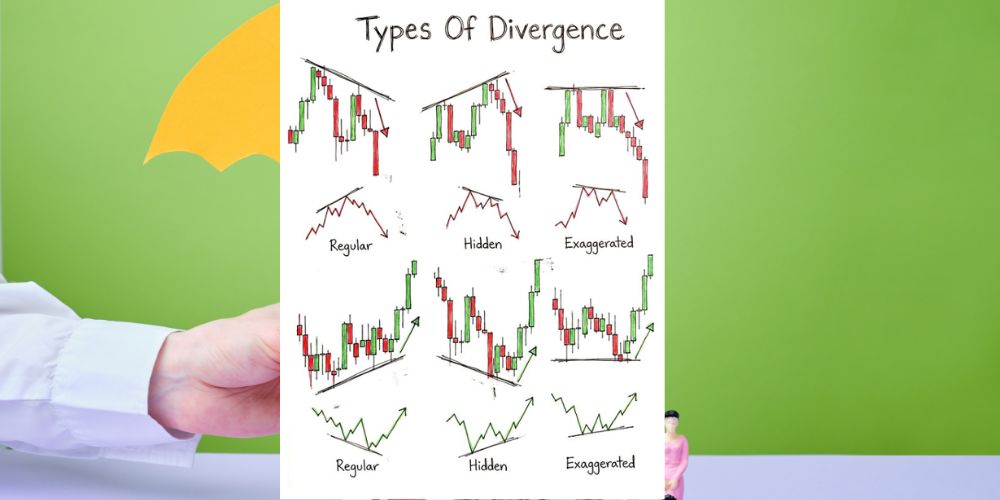
Top3 min readUnderstanding Types of Divergence in Trading: A Guide to Key IndicatorsUnderstanding Types of Divergence in Trading: A Guide to Key Indicators Divergence is a critical concept in technical analysis, widely used by traders to predict potential reversals or continuations in price trends. Divergence occurs when the price of an asset moves in the opposite direction of an indicator, typically a momentum oscillator like the Relative Strength Index (RSI) or Moving Average Convergence Divergence (MACD). The different types of divergence—Regular, Hidden, and Exaggerated—offer distinct insights into market behavior, helping traders make informed decisions based on the relationship between price movements and technical indicators.Dipesh Ghimire·17 Feb, 2026
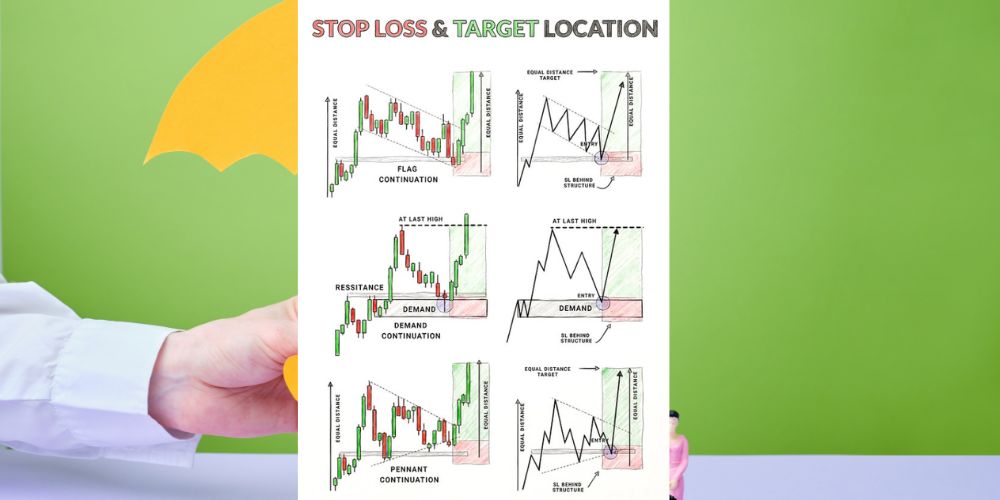
Top3 min readA Comprehensive Guide to Stop Loss and Target Locations in Trading: Insights on Managing Risk and RewardA Comprehensive Guide to Stop Loss and Target Locations in Trading: Insights on Managing Risk and Reward In the world of trading, one of the most critical aspects of risk management involves setting appropriate stop loss and target locations. The use of stop loss orders helps mitigate losses when the market moves unfavorably, while target orders set a clear exit strategy for when a trade hits a desired profit level. The latest trading guide emphasizes different strategies for setting stop loss and target locations, particularly focusing on various chart patterns and their associated risk-reward setups.Dipesh Ghimire·17 Feb, 2026
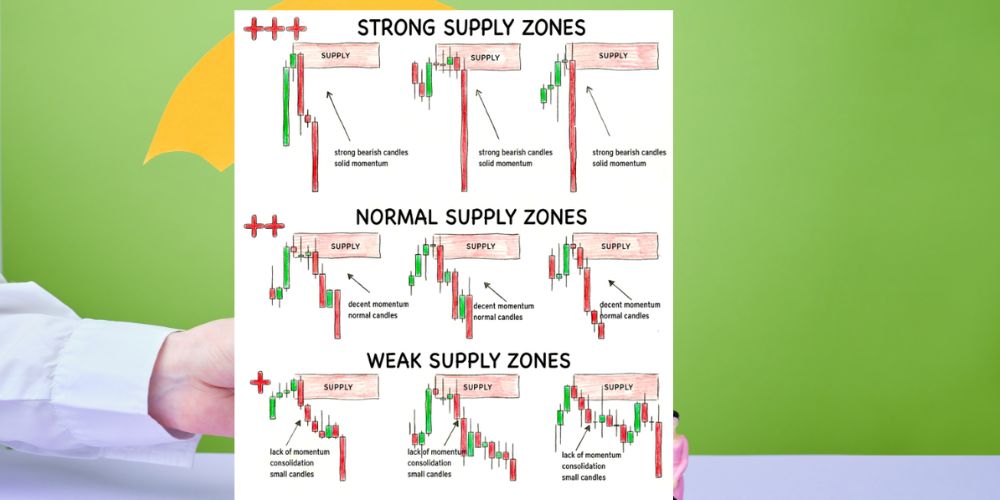
Top3 min readAnalysis of Supply Strength Zones in Market Trends: A Detailed BreakdownAnalysis of Supply Strength Zones in Market Trends: A Detailed Breakdown In recent market analysis, the concept of "Supply Strength Zones" has gained significant attention among traders. These zones, categorized into Strong Supply Zones, Normal Supply Zones, and Weak Supply Zones, provide valuable insights into the behavior of price action and are essential for predicting potential market movements. A deeper understanding of these zones can help investors make informed decisions and improve their trading strategies.Dipesh Ghimire·17 Feb, 2026