By Dipesh Ghimire
Nepal’s Inflation Falls Sharply Despite Market Complaints of Rising Prices

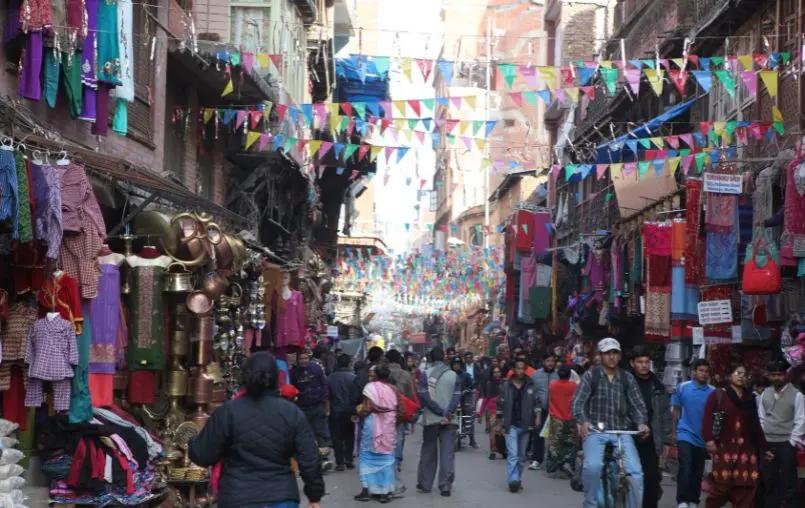
Kathmandu — While consumers across the country continue to feel the pinch of rising market prices—intensified further after the recent Gen-Z protests—Nepal Rastra Bank’s latest macroeconomic report tells a completely different story. According to the central bank, inflation has actually declined significantly compared to last year, contradicting widespread public perception.
The Macroeconomic Update published on Sunday, covering data up to the end of Ashoj, shows that overall inflation has eased markedly during the months of Shrawan, Bhadra and Ashoj in the current fiscal year.
Inflation Drops to 1.47%: A Steep Fall From Last Year
As per NRB, year-on-year point-to-point consumer inflation stood at 1.47% in Ashoj 2082, a sharp decline from 4.82% in the same month last year.
Food and Beverage inflation: 2.54% (Last year: 7.20%)
Non-Food and Services inflation: 2.80% (Last year: 3.49%)
This suggests that, in aggregate, price pressures have eased significantly—at least according to official statistics.
Why Are People Feeling the Opposite?
Inflation, in economic terms, reflects the general rise in prices and a decline in purchasing power. However, short-term shocks, price hikes in specific commodities, and regional variations often shape public perception more strongly than the overall index.
Despite NRB’s low inflation figures, consumers are facing rising market prices because:
Specific daily essentials have become costlier
Retail prices respond quickly to market disruptions, unlike wholesale or long-term indexed calculations
The Gen-Z movement–driven supply and demand distortions caused temporary spikes in essentials
Household inflation (based on what people actually buy) often differs from national inflation (based on a broad basket of goods)
Sector-wise Breakdown: Some Prices Up, Some Down
NRB’s detailed breakdown shows a mixed picture within the food and non-food groups.
Food Items: Mixed Movements
Increased:
Ghee & Oils: 7.75%
Non-alcoholic beverages: 3.71%
Fish & Meat: 3.15%
Decreased:
Vegetables: –15.63%
Spices: –7.82%
Pulses & Legumes: –4.41%
The steep drop in vegetable prices reduced the overall food inflation significantly, even though many urban consumers still report high daily expenses due to unstable retail supply chains.
Non-Food & Services: Noticeable Rise in Key Items
Miscellaneous goods & services: 15.51%
Education: 7.67%
Clothing & Footwear: 6.29%
Tobacco Products: 4.84%
Household equipment: 4.55%
Only the insurance and financial services group saw a decline of 0.3%.
This means expenses related to education, daily-use products and services have increased, contributing to household financial stress.
Urban vs Rural Inflation Pattern
Urban areas: 1.53%
Rural areas: 1.29%
Urban inflation appears slightly higher due to higher living costs, transportation expenses, and more dependency on market-based products.
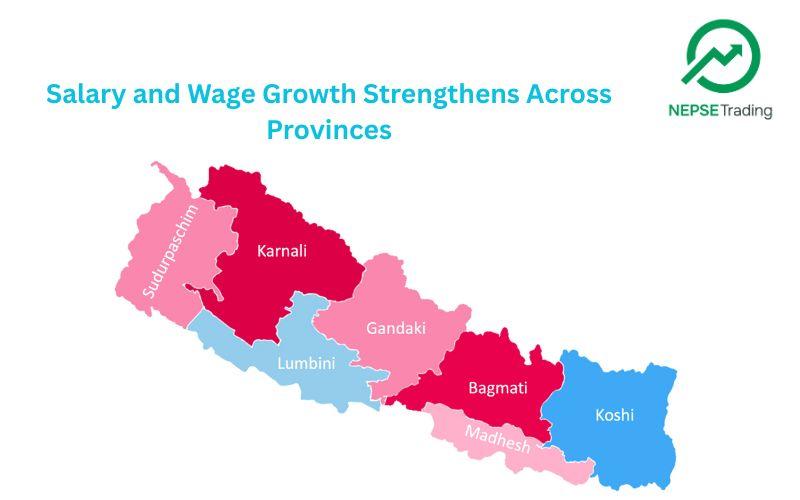
Province-wise Inflation Comparison
Koshi: 2.33%
Madhesh: 1.20%
Bagmati: 1.13%
Gandaki: 1.16%
Lumbini: 1.89%
Karnali: 1.91%
Sudurpashchim: 0.69%
Sudurpashchim recorded the lowest inflation rate, while Koshi Province saw the highest.
Geographical Inflation Differences
Kathmandu Valley: 1.43%
Terai: 1.29%
Hills: 1.50%
Mountains: 2.33%
The Mountain region has experienced the highest inflation due to transport difficulties and higher logistical costs.
Wholesale Inflation Also Falls Sharply
Wholesale price inflation has also dropped:
Overall wholesale inflation: 1.32% (Last year: 5.51%)
Consumable goods: –1.24% (negative inflation)
Intermediate goods: 2.71%
Capital goods: 2.40%
Construction materials: 3.88%
Lower wholesale inflation indicates stable supply markets and reduced pressure on producers.
Interpretation: Why the Gap Between Data and Reality?
Despite the official data showing inflation falling, public experience differs. Economic experts highlight multiple reasons:
Price hikes in frequently purchased goods influence perception more than statistical averages.
Seasonal and supply-chain disruptions raise prices for essentials like vegetables, fuel, and household items.
Retail margins and transportation costs remain high.
Consumer spending patterns differ from the basket used in inflation calculation.
Imported inflation from India affects specific goods unevenly.
NRB’s figures represent national averages across hundreds of items, but consumers notice the prices they buy every day—leading to a sense of “inflation mismatch.”
Nepal Rastra Bank’s latest data paints a picture of easing inflation, with the rate dropping to one of the lowest levels in recent years. However, the public continues to feel the burden of rising household expenses due to increases in specific essentials, service costs, and short-term market disruptions.
The contradiction between data and ground reality suggests a need for closer monitoring of retail markets, revision of inflation baskets, and effective market regulation to ensure that falling inflation translates into real relief for consumers.


