
नेप्से लगातार दोस्रो दिन हरियो, तर प्रतिरोधमा अनिर्णयको ‘डोजी’: बीमाको टेवाNEPSE Edges Up for a Second Day but Prints an Indecisive 'Doji' at Resistance; Insurance Leads, Breadth Mixed
काठमाडौं — नेपाल स्टक एक्सचेन्ज (नेप्से) को परिसूचक बुधबार लगातार दोस्रो दिन वृद्धिसहित बन्द भएको छ । अघिल्लो कारोबार दिनको बढोत्तरीलाई निरन्तरता दिँदै परिसूचक बुधबार २.६६ अंक (०.१० प्रतिशत) ले बढेर २,७८०.२५ विन्दुमा पुगेको हो ।
बुधबार सेन्सिटिभ इन्डेक्स १.९३ अंक, फ्लोट इन्डेक्स ०.४१ अंक र सेन्सिटिभ फ्लोट इन्डेक्स ०.६१ अंकले बढेका छन् । परिसूचकसँगै कारोबार रकम पनि बढ्यो । मंगलबार रु. ५ अर्ब २६ करोडको कारोबार भएकोमा बुधबार ३४७ कम्पनीको ६२ हजार १४८ कारोबारमार्फत रु. ५ अर्ब ७३ करोड ८१ लाखभन्दा बढीको सेयर किनबेच भयो । कुल १ करोड ३५ लाखभन्दा बढी कित्ता सेयर हस्तान्तरण भएको छ ।
बीमा समूहको टेवा, ब्रेडथ मिश्रित
उपसमूहगत रूपमा हेर्दा १३ मध्ये ७ उपसमूहको परिसूचक बढ्यो भने ६ को घट्यो । निर्जीवन बीमा उपसमूह सबैभन्दा बढी ३.३७ प्रतिशतले बढेर बजारलाई टेवा दिएको छ; जीवन बीमा उपसमूह पनि १.५ प्रतिशतभन्दा बढीले उकालो लाग्यो । अन्य उपसमूहमा भने मिश्रित प्रदर्शन देखियो र ‘अन्य’ उपसमूह सर्वाधिक २.३६ प्रतिशतले घट्यो ।
बढ्ने र घट्ने सेयर
कालिन्चोक हाइड्रोपावरको सेयर सकारात्मक सर्किटमा कारोबार भयो; उक्त कम्पनीको मूल्य ७४ रुपैयाँ ७० पैसाले बढेर अन्तिममा ५७२ रुपैयाँ ९० पैसामा कारोबार भएको छ । त्यस्तै ‘८.५ प्रतिशत एसबिएल डिबेन्चर २०८४’ करिब १५ प्रतिशत र विजय लघुवित्त वित्तीय संस्थाको सेयर साढे ८ प्रतिशतभन्दा बढीले बढ्यो । अर्कोतर्फ, नेपाल पुनर्बीमा कम्पनीको सेयर बुधबार ५.१८ प्रतिशतले घट्यो ।
कारोबार रकमका आधारमा बुधबार पनि आँखु खोला जलविद्युत् कम्पनी शीर्षमा रह्यो, जसको रु. ४४ करोड २३ लाखभन्दा बढीको कारोबार भयो । नेपाल पुनर्बीमा कम्पनीको करिब रु. २२ करोड र रिडी पावर कम्पनीको रु. २० करोडभन्दा बढीको कारोबार भएको छ ।
बजार विश्लेषकका अनुसार बीमा समूहको बलियो प्रदर्शनले समग्र परिसूचकलाई सकारात्मक दिशामा राखे पनि अन्य उपसमूहमा देखिएको दबाबले बजारमा मिश्रित प्रवृत्ति कायमै छ ।
प्राविधिक चित्र: प्रतिरोधमा ‘डोजी’
दैनिक (डे) चार्टमा बुधबारको क्यान्डल प्राविधिक दृष्टिले उल्लेखनीय छ । परिसूचकको खुलाइ (२,७८०.२१) र बन्द (२,७८०.२५) झन्डै बराबर हुँदा क्यान्डलको ‘बडी’ निकै सानो बनेको छ; तर माथि र तल दुवैतर्फ लामो ‘छायाँ’ (shadow) छ । यस्तो स्वरूपलाई ‘डोजी’ वा ‘लङ–लेग्ड डोजी’ भनिन्छ, जसले खरिदकर्ता र बिक्रेताबीच निर्णय हुन नसकेको अनिर्णय जनाउँछ ।
विशेषगरी लगातार दुई दिनको वृद्धिपछि प्रतिरोध तहनजिक यस्तो क्यान्डल देखिनुले खरिदकर्ता माथिल्लो तहमा केही सतर्क बनेको संकेत मिल्छ । दिनभरि २,७९९ सम्म पुगे पनि त्यो तह टिकाउन नसकी फेरि तल आएर बन्द हुनुले माथि बिक्रीको दबाब रहेको देखाउँछ ।

सूचकहरूको संकेत: मिश्रित, मोमेन्टम सुधारोन्मुख
चौध दिने सापेक्षिक शक्ति सूचकांक (आरएसआई) ५३.६६ मा छ । यो ५० को मध्यरेखाभन्दा केही माथि भएकाले हल्का सकारात्मक झुकाव देखाउँछ, तर ‘ओभरबट’ (७० माथि) वा ‘ओभरसोल्ड’ (३० मुनि) कुनै चरम अवस्थामा छैन— अर्थात् मोमेन्टम तटस्थ छ, माथि जाने ठाउँ अझै बाँकी छ ।
म्याक्ड (MACD) मा म्याक्ड रेखा सिग्नल रेखामाथि गएर ‘बुलिस क्रसओभर’ बनेको र हिस्टोग्राम सकारात्मक हुँदै बढिरहेको देखिन्छ; यसले छोटो अवधिको मोमेन्टम सुधारिएको मामुली सकारात्मक संकेत दिन्छ ।
इचिमोकु सूचकअनुसार परिसूचक तेन्कान रेखा (करिब २,७५९.९५) र किजुन रेखा (करिब २,७४८.४६) दुवैभन्दा माथि कारोबार भइरहेको छ, जुन छोटो अवधिमा सकारात्मक हो । तर माथि इचिमोकु ‘क्लाउड’ र २,८०० देखि २,८२० को क्षेत्र प्रतिरोधका रूपमा खडा छ । कारोबार परिमाण (भोलुम) करिब रु. ५.७४ अर्ब रहँदा सानो वृद्धिलाई मामुली साथ मिलेको देखिन्छ ।
प्रतिरोध र समर्थनका तह
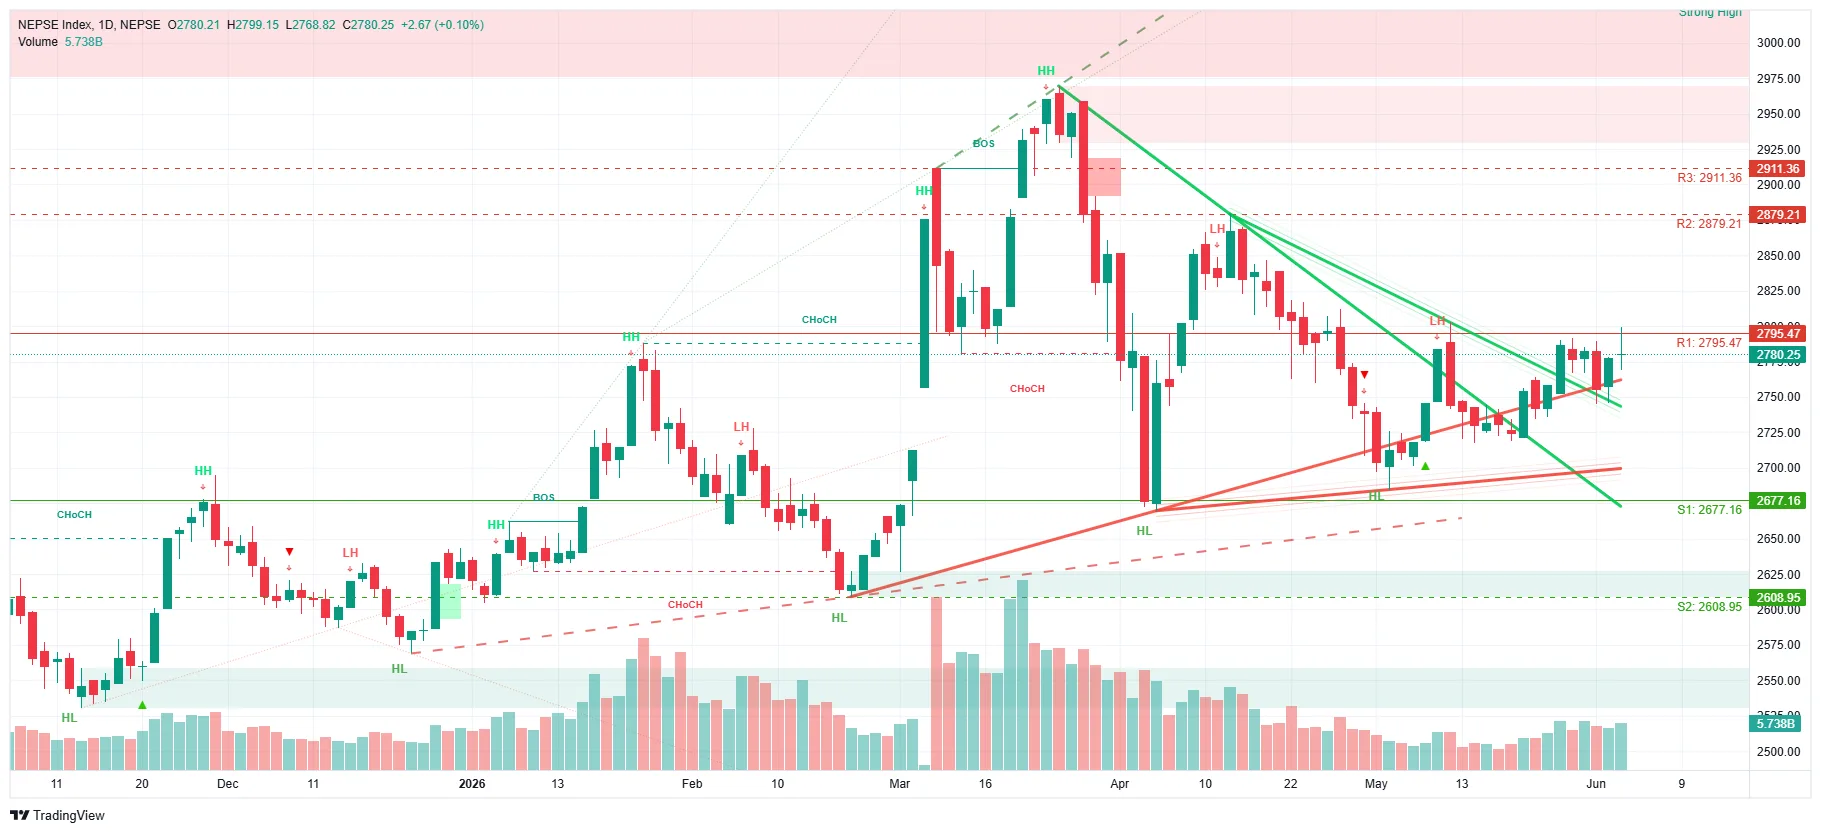
बजार संरचनात्मक (एसएमसी) दृष्टिले नेप्से एउटा खुम्चिँदो दायरा (कन्ट्र्याक्टिङ ट्रायाङ्गल) भित्र छ । माथिबाट झर्दो प्रतिरोध रेखा (मार्चको करिब २,९७५ को उच्च बिन्दुयता बन्दै आएका ‘लोअर हाई’) र तलबाट उक्लिँदो समर्थन रेखा (अप्रिलको करिब २,६७७ को तल्लो बिन्दुयता बन्दै आएका ‘हायर लो’) नजिकिँदै छन् । परिसूचक अहिले यो दायराको माथिल्लो किनारा— प्रतिरोध तहनजिक छ ।
तत्कालको प्रतिरोध तह आर–१ रु. २,७९५.४७ हो; दिनभरि यो तहमाथि (२,७९९) पुगे पनि बन्द भने त्यसैभन्दा तल भयो । यस तहमाथि निर्णायक रूपमा बन्द भए आर–२ (२,८७९.२१) र आर–३ (२,९११.३६) तर्फ बाटो खुल्न सक्छ; माथि करिब २,९५० देखि २,९७५ को क्षेत्रमा बलियो आपूर्ति (स्ट्रङ हाई) तह छ । तल्लोतर्फ तत्कालको समर्थन उक्लिँदो ट्रेन्डलाइन र किजुन रेखा (करिब २,७४८) हो; त्यसमुनि एस–१ रु. २,६७७.१६ र एस–२ रु. २,६०८.९५ महत्त्वपूर्ण समर्थन तह मानिन्छन्
KATHMANDU — The Nepal Stock Exchange (NEPSE) index closed higher for a second consecutive trading day on Wednesday. Extending the previous session's gains, the benchmark rose 2.66 points, or 0.10 percent, to settle at 2,780.25.
The Sensitive Index gained 1.93 points, the Float Index 0.41 points and the Sensitive Float Index 0.61 points. Turnover also picked up: against Tuesday's Rs 5.26 billion, Wednesday saw shares worth more than Rs 5.73 billion change hands through 62,148 transactions across 347 scrips. In all, more than 1.35 crore (13.5 million) share units were traded.
Insurance Lends Support, Breadth Mixed
Of the 13 sub-indices, seven advanced and six declined. The Non-Life Insurance sub-index led the gains, climbing 3.37 percent to prop up the broader market, while Life Insurance rose more than 1.5 percent. Performance elsewhere was mixed, with the 'Others' sub-index falling the most, down 2.36 percent.
Top Gainers and Losers
Kalinchowk Hydropower hit its positive circuit, its share price rising Rs 74.70 to close at Rs 572.90. The '8.5% SBL Debenture 2084' jumped about 15 percent, and Vijaya Laghubitta Bittiya Sanstha climbed more than 8.5 percent. On the other side, Nepal Reinsurance Company fell 5.18 percent.
By turnover, Aankhu Khola Hydropower again topped the chart with trades worth more than Rs 44.23 crore. Nepal Reinsurance Company recorded around Rs 22 crore and Ridi Power Company over Rs 20 crore.
According to market analysts, while the insurance group's strong performance kept the headline index positive, pressure in other sub-groups left an overall mixed tone in the market.
Technical Picture: A 'Doji' at Resistance

On the daily chart, Wednesday's candle was technically notable. With the open (2,780.21) and close (2,780.25) almost identical, the candle's 'body' was very small, yet it carried long shadows on both the upper and lower sides. Such a formation is known as a 'doji', or 'long-legged doji', and signals indecision between buyers and sellers.
Coming after two straight up days and forming near resistance, the candle suggests buyers turned cautious at higher levels. The index reached 2,799 intraday but could not hold there, slipping back to close below it — a sign of selling pressure overhead.
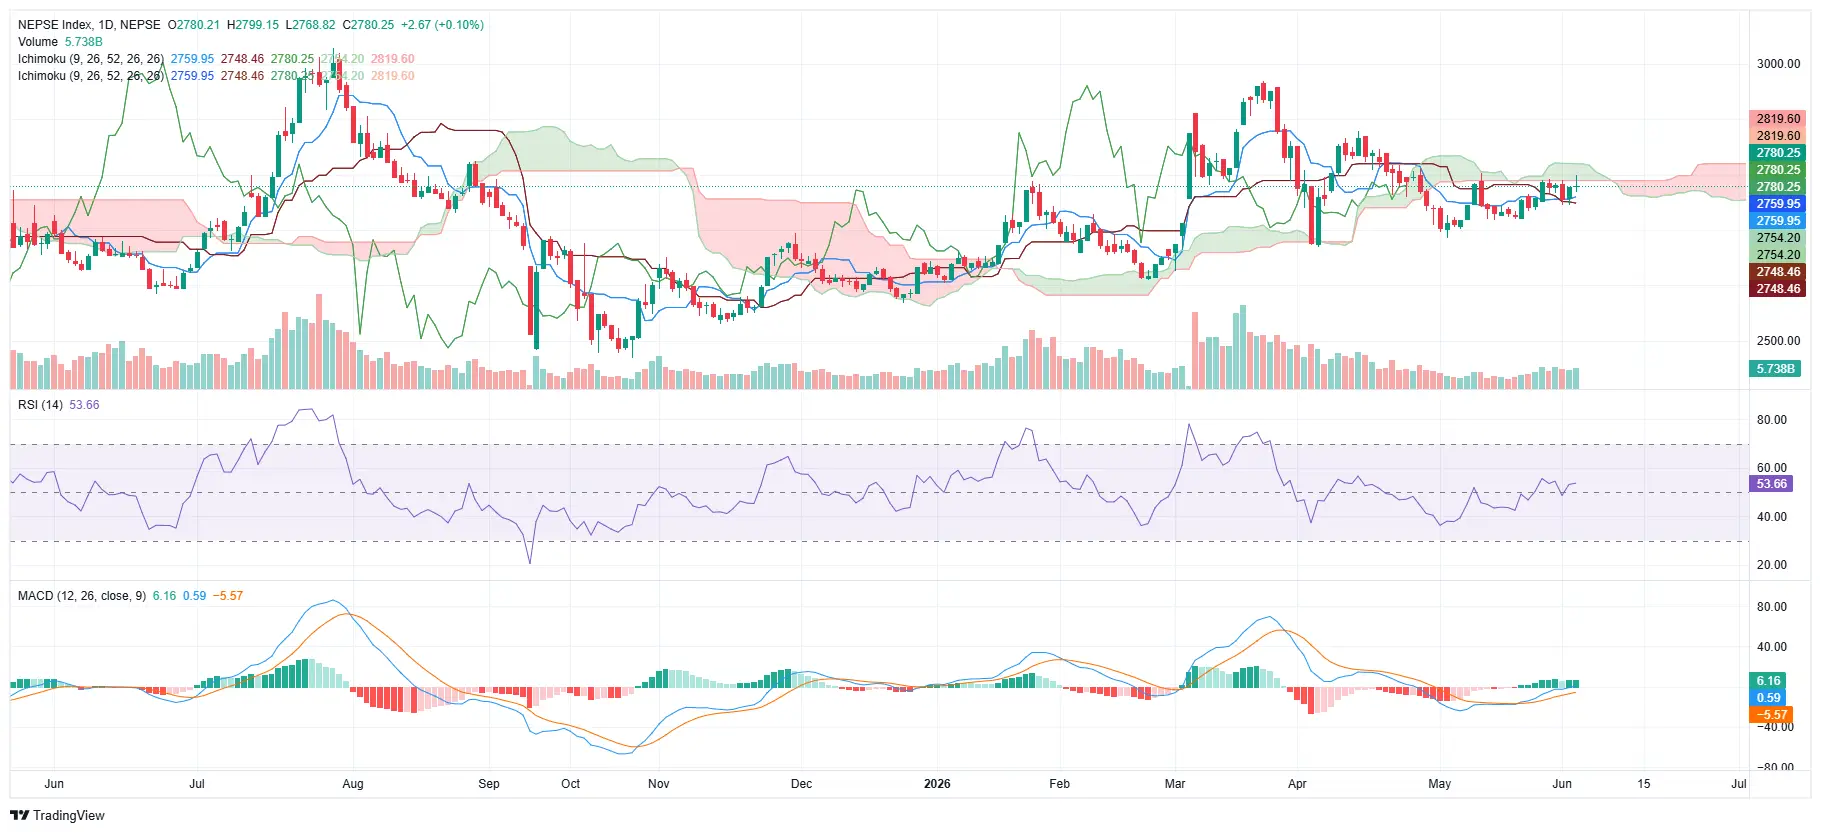
What the Indicators Say: Mixed, With Improving Momentum
The 14-day Relative Strength Index (RSI) stands at 53.66. Sitting just above the 50 midline, it shows a mild positive bias but is neither 'overbought' (above 70) nor 'oversold' (below 30) — meaning momentum is broadly neutral, with room to move higher.
On the MACD, the MACD line has crossed above the signal line in a 'bullish crossover', and the histogram has turned positive and is expanding — a modestly positive signal that short-term momentum is improving.
By the Ichimoku reading, the index is trading above both the Tenkan line (around 2,759.95) and the Kijun line (around 2,748.46), which is positive in the short term. Above, however, the Ichimoku cloud and the 2,800–2,820 zone stand as resistance. Volume of about Rs 5.74 billion lent only modest support to the small gain.
Resistance and Support Levels
From a market-structure (SMC) standpoint, NEPSE is caught within a contracting range, or contracting triangle. A descending resistance line — the series of 'lower highs' since the roughly 2,975 peak in March — and a rising support line — the 'higher lows' built since the roughly 2,677 low in April — are converging. The index now sits near the upper edge of this range, close to resistance.
Immediate resistance is R1 at 2,795.47; the index pushed above it (to 2,799) intraday but closed below. A decisive close above this level could open the way toward R2 (2,879.21) and R3 (2,911.36), with a strong supply ('Strong High') zone around 2,950–2,975 further up. On the downside, immediate support lies at the rising trendline and the Kijun line (around 2,748), below which S1 at 2,677.16 and S2 at 2,608.95 are seen as key supports.


